Twice a Year Scientific Journal
Twice a Year Scientific Journal
Twice a Year Scientific Journal

You also want an ePaper? Increase the reach of your titles
YUMPU automatically turns print PDFs into web optimized ePapers that Google loves.
86<br />
Economic Analysis (2010, Vol. 43, No. 1-2, 83-90)<br />
Models (Model 1: Age groups together; Model 2: Ages 15 – 64) meet assumptions of<br />
classical regression. Variables are integrated of first order I (1). They are co integrated, that<br />
means, their linear combination is I (0), and it is stationary. Lags of exogenous variables were<br />
set empirically.<br />
It is evident that the value of Kaitz index expressed as a share of minimum wage to<br />
average wage level in national economy under Slovak conditions moved from about 33 % at<br />
the beginning of the observed period to about 42 % in the first quarter of the year 2009. Value<br />
of the Kaitz index varies along with the level of average wage in national economy in<br />
corresponding quarter. The level of minimum wage is set forth in advance and remains<br />
unchanged for the entire year in Slovakia.<br />
Regression (2) expresses the relation between minimum wage and employment of both of<br />
the investigated structures - files (one that encompasses all employed people; second that<br />
involves workers in the age 15 - 64) along with a control variable - labour productivity.<br />
Y β + β X + β X 2 + β Y + u ,<br />
(2)<br />
t = 0 1 1t<br />
−1<br />
2 t −1<br />
3 t −1<br />
t<br />
whereas Yt is a time series expressing rate of employment of observed file; X1t is a share of<br />
minimum wage to average wage; X2t denotes labour productivity; ß0,1,2,3, express parameters;<br />
ut denotes random error term. Tables 1, 2 present the results – values of coefficients.<br />
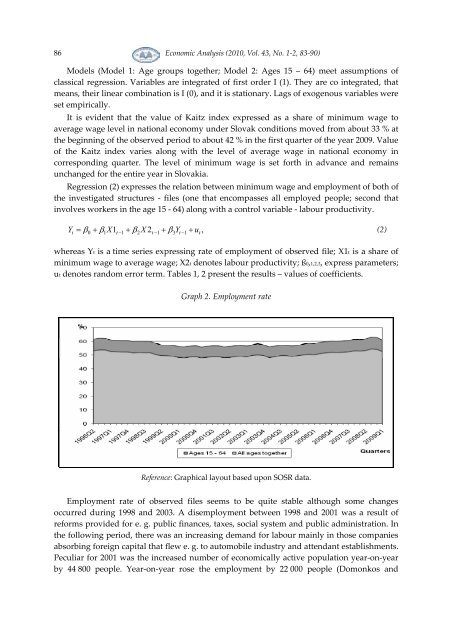
Graph 2. Employment rate<br />
Reference: Graphical layout based upon SOSR data.<br />
Employment rate of observed files seems to be quite stable although some changes<br />
occurred during 1998 and 2003. A disemployment between 1998 and 2001 was a result of<br />
reforms provided for e. g. public finances, taxes, social system and public administration. In<br />
the following period, there was an increasing demand for labour mainly in those companies<br />
absorbing foreign capital that flew e. g. to automobile industry and attendant establishments.<br />
Peculiar for 2001 was the increased number of economically active population year-on-year<br />
by 44 800 people. <strong>Year</strong>-on-year rose the employment by 22 000 people (Domonkos and