Twice a Year Scientific Journal
Twice a Year Scientific Journal
Twice a Year Scientific Journal

Create successful ePaper yourself
Turn your PDF publications into a flip-book with our unique Google optimized e-Paper software.
Tej, J., Economic Assessment of Selected Bank Mergers, EA (2010, Vol. 43, No, 1-2, 34-43) 41<br />
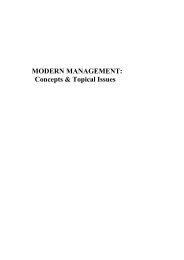
Graph 7. Market price of shares<br />
200<br />
180<br />
160<br />
140<br />
120<br />
100<br />
80<br />
-3 -2 -1 year of<br />
merger<br />
Central and Eastern Europe<br />
1 2 3<br />
developed countries<br />
Source: author<br />
Note except Slovenská sporiteľňa, BCR, HVB Bank and UNI Bank, which shares are not publicly traded.<br />
One year after the merger took place as expected, fall in central banks stock prices, but it<br />
was already deleted the next year and a year later, the average price reached 170% of the<br />
initial value. The curve of banks from developed economies has fall in mergerʹs year, but the<br />
following period was marked by a sharp strengthening price of shares up to 190% of initial<br />
value in the third year after the merger.<br />
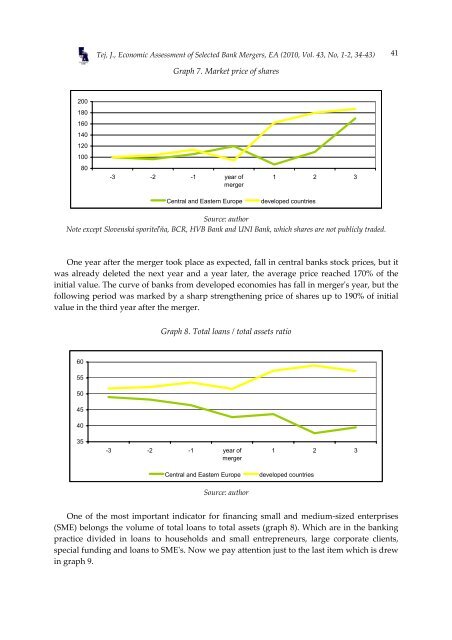
Graph 8. Total loans / total assets ratio<br />
60<br />
55<br />
50<br />
45<br />
40<br />
35<br />
-3 -2 -1 year of<br />
merger<br />
Central and Eastern Europe<br />
Source: author<br />
1 2 3<br />
developed countries<br />
One of the most important indicator for financing small and medium-sized enterprises<br />
(SME) belongs the volume of total loans to total assets (graph 8). Which are in the banking<br />
practice divided in loans to households and small entrepreneurs, large corporate clients,<br />
special funding and loans to SMEʹs. Now we pay attention just to the last item which is drew<br />
in graph 9.