Twice a Year Scientific Journal
Twice a Year Scientific Journal
Twice a Year Scientific Journal

Create successful ePaper yourself
Turn your PDF publications into a flip-book with our unique Google optimized e-Paper software.
40<br />
Economic Analysis (2010, Vol. 43, No. 1-2, 34-43)<br />
Graph 5. shows the performance of banks as measured by ROE. It indicates to<br />
shareholders how effective their investments in shares are. Visible is a positive increase in<br />
banks in Central and Eastern Europe. Already one year before the merger they reached a<br />
significant positive value and growth trend is maintained until the end of the period. By<br />
contrast the group of mergers in developed economies has value of ROE still in the range 10<br />
to 20% without significant changes in the mergerʹs year. Thus the merger did not bring any<br />
significant effect to shareholders in the long run.<br />
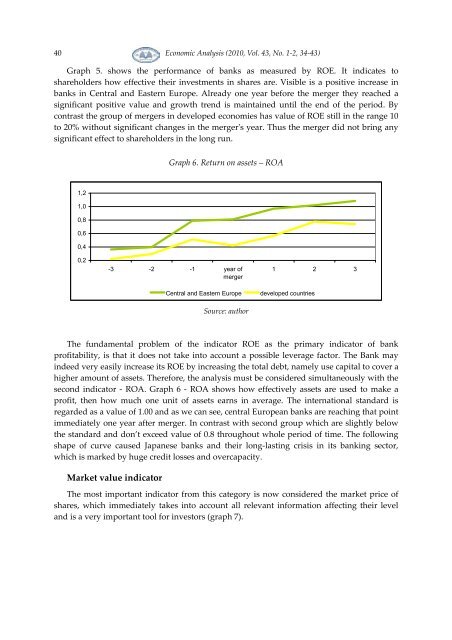
Graph 6. Return on assets – ROA<br />
1,2<br />
1,0<br />
0,8<br />
0,6<br />
0,4<br />
0,2<br />
-3 -2 -1 year of<br />
merger<br />
Central and Eastern Europe<br />
Source: author<br />
1 2 3<br />
developed countries<br />
The fundamental problem of the indicator ROE as the primary indicator of bank<br />
profitability, is that it does not take into account a possible leverage factor. The Bank may<br />
indeed very easily increase its ROE by increasing the total debt, namely use capital to cover a<br />
higher amount of assets. Therefore, the analysis must be considered simultaneously with the<br />
second indicator - ROA. Graph 6 - ROA shows how effectively assets are used to make a<br />
profit, then how much one unit of assets earns in average. The international standard is<br />
regarded as a value of 1.00 and as we can see, central European banks are reaching that point<br />
immediately one year after merger. In contrast with second group which are slightly below<br />
the standard and don’t exceed value of 0.8 throughout whole period of time. The following<br />
shape of curve caused Japanese banks and their long-lasting crisis in its banking sector,<br />
which is marked by huge credit losses and overcapacity.<br />
Market value indicator<br />
The most important indicator from this category is now considered the market price of<br />
shares, which immediately takes into account all relevant information affecting their level<br />
and is a very important tool for investors (graph 7).