Twice a Year Scientific Journal
Twice a Year Scientific Journal
Twice a Year Scientific Journal

Create successful ePaper yourself
Turn your PDF publications into a flip-book with our unique Google optimized e-Paper software.
Tej, J., Economic Assessment of Selected Bank Mergers, EA (2010, Vol. 43, No, 1-2, 34-43) 39<br />
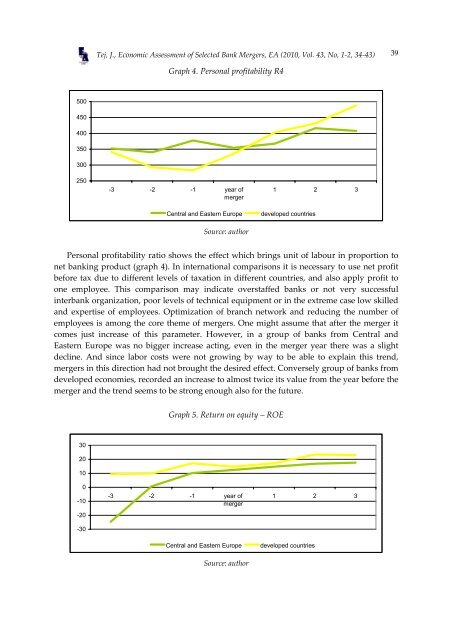
Graph 4. Personal profitability R4<br />
500<br />
450<br />
400<br />
350<br />
300<br />
250<br />
-3 -2 -1 year of<br />
merger<br />
Central and Eastern Europe<br />
Source: author<br />
1 2 3<br />
developed countries<br />
Personal profitability ratio shows the effect which brings unit of labour in proportion to<br />
net banking product (graph 4). In international comparisons it is necessary to use net profit<br />
before tax due to different levels of taxation in different countries, and also apply profit to<br />
one employee. This comparison may indicate overstaffed banks or not very successful<br />
interbank organization, poor levels of technical equipment or in the extreme case low skilled<br />
and expertise of employees. Optimization of branch network and reducing the number of<br />
employees is among the core theme of mergers. One might assume that after the merger it<br />
comes just increase of this parameter. However, in a group of banks from Central and<br />
Eastern Europe was no bigger increase acting, even in the merger year there was a slight<br />
decline. And since labor costs were not growing by way to be able to explain this trend,<br />
mergers in this direction had not brought the desired effect. Conversely group of banks from<br />
developed economies, recorded an increase to almost twice its value from the year before the<br />
merger and the trend seems to be strong enough also for the future.<br />
Graph 5. Return on equity – ROE<br />
30<br />
20<br />
10<br />
0<br />
-10<br />
-20<br />
-30<br />
-3 -2 -1 year of<br />
merger<br />
Central and Eastern Europe<br />
Source: author<br />
1 2 3<br />
developed countries