Twice a Year Scientific Journal
Twice a Year Scientific Journal
Twice a Year Scientific Journal

You also want an ePaper? Increase the reach of your titles
YUMPU automatically turns print PDFs into web optimized ePapers that Google loves.
72<br />
Economic Analysis (2010, Vol. 43, No. 1-2, 70-82)<br />
by calculating the CPIs. [7] OOH is included in the CPI for example in Denmark, Sweden,<br />
Germany, Ireland, Netherlands, Austria and Finland, but this countries use different<br />
approaches to cover OOH. In the HICP is OOH still excluded, because it has not yet been<br />
decided how owner-occupied housing should be covered. [1]<br />
The differences are formed by rounding the indices on individual aggregation levels too.<br />
[9] Some national statistical institutes use different aggregation formulas in their national<br />
CPI and HICP for aggregation at the lowest levels of the index. [7] The consumption basket<br />
and the expenditure shares of the items covered in the national CPIs and the HICPs may be<br />
updated at different intervals. [7] France, Italy, Luxemburg, Portugal, Estonia, Latvia,<br />
Lithuania, Slovenia, Sweden and UK update weights in consumer basket for calculating the<br />
national CPIs annually. The other member states review basket weights mostly every five<br />
years. Updates interval in Greece is as late as six years. [1] Different update interval leads to<br />
the fact that there are many new goods and services which are in basket of the HICP, but the<br />
CPI does not cover them yet. For example organic food, air tickets, mobile phones and<br />
computers, were covered in the HICP sooner than in the CPI in Belgium. [6] The methods<br />
used to estimate prices for goods when their quality is changing over time are differ across<br />
countries. The differences are in coverage of price reductions during winter and summer<br />
sales periods. There may be also differences between the national classifications used for the<br />
CPI and the harmonized classification of the HICP. [8]<br />
The progress of the HICPs and the CPIs is shown in Picture 1 in the annex.<br />
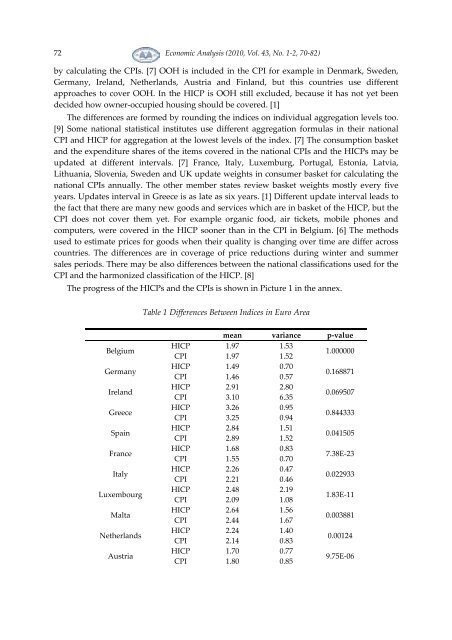
Table 1 Differences Between Indices in Euro Area<br />
Belgium<br />
Germany<br />
Ireland<br />
Greece<br />
Spain<br />
France<br />
Italy<br />
Luxembourg<br />
Malta<br />
Netherlands<br />
Austria<br />
mean variance p-value<br />
HICP 1.97 1.53<br />
CPI 1.97 1.52<br />
1.000000<br />
HICP 1.49 0.70<br />
CPI 1.46 0.57<br />
0.168871<br />
HICP 2.91 2.80<br />
CPI 3.10 6.35<br />
0.069507<br />
HICP 3.26 0.95<br />
CPI 3.25 0.94<br />
0.844333<br />
HICP 2.84 1.51<br />
CPI 2.89 1.52<br />
0.041505<br />
HICP 1.68 0.83<br />
CPI 1.55 0.70<br />
7.38E-23<br />
HICP 2.26 0.47<br />
CPI 2.21 0.46<br />
0.022933<br />
HICP 2.48 2.19<br />
CPI 2.09 1.08<br />
1.83E-11<br />
HICP 2.64 1.56<br />
CPI 2.44 1.67<br />
0.003881<br />
HICP 2.24 1.40<br />
CPI 2.14 0.83<br />
0.00124<br />
HICP 1.70 0.77<br />
CPI 1.80 0.85<br />
9.75E-06