Twice a Year Scientific Journal
Twice a Year Scientific Journal
Twice a Year Scientific Journal

Create successful ePaper yourself
Turn your PDF publications into a flip-book with our unique Google optimized e-Paper software.
48<br />
Economic Analysis (2010, Vol. 43, No. 1-2, 44-49)<br />
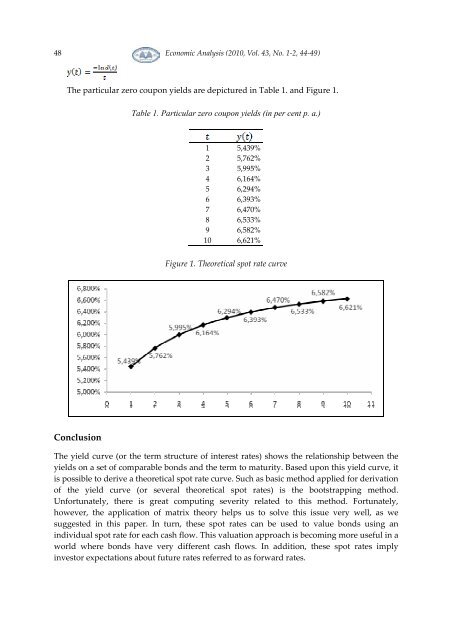
The particular zero coupon yields are depictured in Table 1. and Figure 1.<br />
Table 1. Particular zero coupon yields (in per cent p. a.)<br />
1 5,439%<br />
2 5,762%<br />
3 5,995%<br />
4 6,164%<br />
5 6,294%<br />
6 6,393%<br />
7 6,470%<br />
8 6,533%<br />
9 6,582%<br />
10 6,621%<br />
Figure 1. Theoretical spot rate curve<br />
Conclusion<br />
The yield curve (or the term structure of interest rates) shows the relationship between the<br />
yields on a set of comparable bonds and the term to maturity. Based upon this yield curve, it<br />
is possible to derive a theoretical spot rate curve. Such as basic method applied for derivation<br />
of the yield curve (or several theoretical spot rates) is the bootstrapping method.<br />
Unfortunately, there is great computing severity related to this method. Fortunately,<br />
however, the application of matrix theory helps us to solve this issue very well, as we<br />
suggested in this paper. In turn, these spot rates can be used to value bonds using an<br />
individual spot rate for each cash flow. This valuation approach is becoming more useful in a<br />
world where bonds have very different cash flows. In addition, these spot rates imply<br />
investor expectations about future rates referred to as forward rates.