Full document - International Hospital Federation
Full document - International Hospital Federation
Full document - International Hospital Federation

Create successful ePaper yourself
Turn your PDF publications into a flip-book with our unique Google optimized e-Paper software.
Innovation in clinical specialities: cardiovascular disease<br />
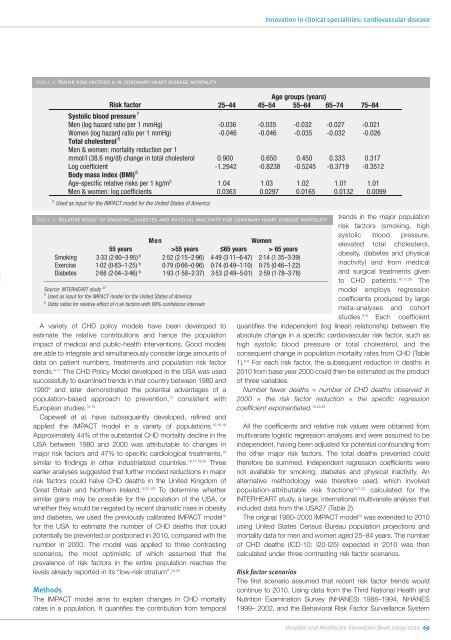
Table 1: Major risk factors a in coronary heart disease mortality<br />
Age groups (years)<br />
Risk factor 25–44 45–54 55–64 65–74 75–84<br />
Systolic blood pressure 7<br />
Men (log hazard ratio per 1 mmHg) -0.036 -0.035 -0.032 -0.027 -0.021<br />
Women (log hazard ratio per 1 mmHg)<br />
-0.046 -0.046 -0.035 -0.032 -0.026<br />
Total cholesterol 6<br />
Men & women: mortality reduction per 1<br />
mmol/l (38.6 mg/dl) change in total cholesterol 0.900 0.650 0.450 0.333 0.317<br />
Log coefficient -1.2942 -0.8238 -0.5245 -0.3719 -0.3512<br />
Body mass index (BMI) 8<br />
Age-specific relative risks per 1 kg/m 2 1.04 1.03 1.02 1.01 1.01<br />
c<br />
Men & women: log coefficients<br />
0.0363 0.0297 0.0165 0.0132 0.0099<br />
a Used as input for the IMPACT model for the United States of America<br />
Table 2: Relative risks a of smoking, diabetes and physical inactivity for coronary heart disease mortality<br />
Men<br />
Women<br />
55 years >55 years ≤65 years > 65 years<br />
Smoking 3·33 (2·80–3·95) b 2·52 (2·15–2·96) 4·49 (3·11–6·47) 2·14 (1·35–3·39)<br />
Exercise 1·02 (0·83–1·25) b 0·79 (0·66–0·96) 0·74 (0·49–1·10) 0·75 (0·46–1·22)<br />
Diabetes 2·66 (2·04–3·46) b 1·93 (1·58–2·37) 3·53 (2·49–5·01) 2·59 (1·78–3·78)<br />
Source: INTERHEART study 27<br />
a Used as input for the IMPACT model for the United States of America<br />
b<br />
Odds ratios for relative effect of ri sk factors with 99% confidence intervals<br />
A variety of CHD policy models have been developed to<br />
estimate the relative contributions and hence the population<br />
impact of medical and public-health interventions. Good models<br />
are able to integrate and simultaneously consider large amounts of<br />
data on patient numbers, treatments and population risk factor<br />
trends. 9–11 The CHD Policy Model developed in the USA was used<br />
successfully to examined trends in that country between 1980 and<br />
1990 9 and later demonstrated the potential advantages of a<br />
population-based approach to prevention, 12 consistent with<br />
European studies. 13-15<br />
Capewell et al. have subsequently developed, refined and<br />
applied the IMPACT model in a variety of populations. 10,16-19<br />
Approximately 44% of the substantial CHD mortality decline in the<br />
USA between 1980 and 2000 was attributable to changes in<br />
major risk factors and 47% to specific cardiological treatments, 10<br />
similar to findings in other industrialized countries. 16,17,19,20 Three<br />
earlier analyses suggested that further modest reductions in major<br />
risk factors could halve CHD deaths in the United Kingdom of<br />
Great Britain and Northern Ireland. 15,21–23 To determine whether<br />
similar gains may be possible for the population of the USA, or<br />
whether they would be negated by recent dramatic rises in obesity<br />
and diabetes, we used the previously calibrated IMPACT model 10<br />
for the USA to estimate the number of CHD deaths that could<br />
potentially be prevented or postponed in 2010, compared with the<br />
number in 2000. The model was applied to three contrasting<br />
scenarios, the most optimistic of which assumed that the<br />
prevalence of risk factors in the entire population reaches the<br />
levels already reported in its “low-risk stratum”. 24,25<br />
Methods<br />
The IMPACT model aims to explain changes in CHD mortality<br />
rates in a population. It quantifies the contribution from temporal<br />
trends in the major population<br />
risk factors (smoking, high<br />
systolic blood pressure,<br />
elevated total cholesterol,<br />
obesity, diabetes and physical<br />
inactivity) and from medical<br />
and surgical treatments given<br />
to CHD patients. 10,17,26 The<br />
model employs regression<br />
coefficients produced by large<br />
meta-analyses and cohort<br />
studies. 6-8 Each coefficient<br />
quantifies the independent (log linear) relationship between the<br />
absolute change in a specific cardiovascular risk factor, such as<br />
high systolic blood pressure or total cholesterol, and the<br />
consequent change in population mortality rates from CHD (Table<br />
1). 6-8 For each risk factor, the subsequent reduction in deaths in<br />
2010 from base year 2000 could then be estimated as the product<br />
of three variables:<br />
Number fewer deaths = number of CHD deaths observed in<br />
2000 × the risk factor reduction × the specific regression<br />
coefficient exponentiated. 10,22,23<br />
All the coefficients and relative risk values were obtained from<br />
multivariate logistic regression analyses and were assumed to be<br />
independent, having been adjusted for potential confounding from<br />
the other major risk factors. The total deaths prevented could<br />
therefore be summed. Independent regression coefficients were<br />
not available for smoking, diabetes and physical inactivity. An<br />
alternative methodology was therefore used, which involved<br />
population-attributable risk fractions 9,21,22 calculated for the<br />
INTERHEART study, a large, international multivariate analysis that<br />
included data from the USA27 (Table 2).<br />
The original 1980–2000 IMPACT model 10 was extended to 2010<br />
using United States Census Bureau population projections and<br />
mortality data for men and women aged 25–84 years. The number<br />
of CHD deaths (ICD-10: I20-I25) expected in 2010 was then<br />
calculated under three contrasting risk factor scenarios.<br />
Risk factor scenarios<br />
The first scenario assumed that recent risk factor trends would<br />
continue to 2010. Using data from the Third National Health and<br />
Nutrition Examination Survey (NHANES) 1988–1994, NHANES<br />
1999– 2002, and the Behavioral Risk Factor Surveillance System<br />
<strong>Hospital</strong> and Healthcare Innovation Book 2009/2010 69