Full document - International Hospital Federation
Full document - International Hospital Federation
Full document - International Hospital Federation

Create successful ePaper yourself
Turn your PDF publications into a flip-book with our unique Google optimized e-Paper software.
Innovation in clinical specialities: cardiovascular disease<br />
(1988–2002), 3,4 linear projections were made from 1988–1994<br />
through 1999–2002 to the country’s population in 2010 of recent<br />
trends in total cholesterol (mg/dl), smoking (%), systolic blood<br />
pressure (mmHg), body mass index (BMI) (kg/m 2 ), all diabetes (%)<br />
and any leisure-time physical activity (%), all stratified by age and<br />
sex 10,22,23 (Table 3).<br />
The second scenario assumed risk factor levels equal to the<br />
substantial but feasible reductions defined in the HP2010<br />
objectives. 3 In the absence of specific HP2010 targets for BMI,<br />
total diabetes and systolic blood pressure, we assumed that: (i)<br />
the 15% obesity target would equate to a population mean BMI of<br />
25 kg/m 2 for men and 26 kg/m 2 for women; (ii) the 25 per 1000<br />
population clinically diagnosed diabetes prevalence target would<br />
equate to a total (diagnosed and undiagnosed) type 1 and type 2<br />
diabetes prevalence of 6%; and (iii) the 16% hypertension<br />
prevalence target would equate to a population mean systolic<br />
blood pressure of 119 mmHg, representing a 5 mmHg reduction<br />
from 2000 levels (Table 3).<br />
In the third scenario, mean population risk factors were<br />
assumed to reach levels already observed in the “healthiest”<br />
stratum of cohorts in the USA, as defined by Stamler et al. 24 and<br />
Daviglus et al. 25 Levels for specific risk factors were as follows: (i)<br />
no smoking among men or women; (ii) 175.6 mg/dl (4.54 mmol/l)<br />
total cholesterol for men and 179.6 mg/dl (4.64 mmol/l) for<br />
women; (iii) a mean systolic blood pressure of 115.7 mmHg for<br />
men and 114.7 mmHg for women, representing a 10mmHg<br />
reduction from 2000 levels; (iv) a BMI of 25.5 kg/m 2 for men and<br />
23.6 kg/m 2 for women; (v) zero prevalence of diabetes among<br />
both men and women. 24,25 Physical activity was not specifically<br />
considered by in these studies, 24,25 so we defined the level in the<br />
lowest risk stratum as 100%, with everyone undertaking some<br />
leisure-time physical activity. (Table 3). To preserve the focus on<br />
risk factor changes, we assumed that the proportion of the<br />
population receiving medical and surgical treatments for CHD<br />
would remain constant.<br />
Sensitivity analysis<br />
Because of the uncertainties surrounding some of the estimates,<br />
a multi-way sensitivity analysis was performed using the analysis<br />
of extremes method. 28 Minimum and maximum estimates of<br />
deaths prevented or postponed were generated using minimum<br />
and maximum plausible values for the main parameters: 95%<br />
confidence intervals when available; otherwise, the best value<br />
±20%. 10,22,23,28 The Supplementary Appendix (available at:<br />
http://content.nejm.org/cgi/data/356/23/2388/DC1/1) provides<br />
worked examples of the calculations used in the model plus<br />
further details on the methods and data sources used. 10<br />
Results<br />
Trends and estimates<br />
Approximately 388 000 CHD deaths among people aged 25–84<br />
years would be expected in 2010 if the same age-specific death<br />
rates recorded in 2000 (the base year) were also observed in<br />
2010. This number would represent 15% more than the 338 000<br />
deaths observed in 2000, reflecting population aging<br />
compounded by an increase in population size (Table 4).<br />
Between 1997 and 2002, the overall annual declines observed<br />
in CHD mortality rates were 2% for men and 1% for women.<br />
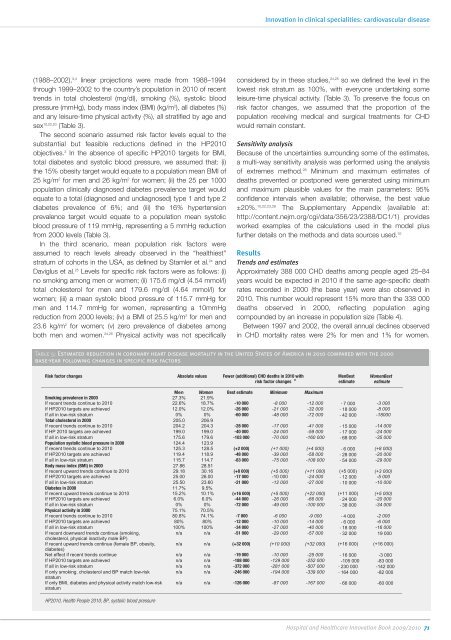
Table base-year 5: Estimated following reduction changes in coronary in specific heart risk factors disease mortality in the United States of America in 2010 compared with the 2000<br />
base-year following changes in specific risk factors<br />
Risk factor changes<br />
Absolute values<br />
Fewer (additional) CHD deaths in 2010 with<br />
risk factor changes a<br />
MenBest<br />
estimate<br />
WomenBest<br />
estimate<br />
Men Women Best estimate Minimum Maximum<br />
Smoking prevalence in 2000 27.3% 21.9%<br />
If<br />
recent trends continue to 2010<br />
22.6% 18.7% -10 000 -8 000 -12 000 - 7 000 -3 000<br />
If<br />
HP2010 targets are achieved<br />
12.0% 12.0% -26 000 -21 000 -32 000 - 18 000 -8 000<br />
If<br />
all in low-risk stratum<br />
0% 0%<br />
-60 000 -48 000 -72 000 - 42 000 -18000<br />
Total cholesterol in 2000 205.0 206.9<br />
If<br />
recent trends continue to 2010<br />
204.2 204.3 -28 000 -17 000 -41 000 - 15 000 -14 000<br />
If<br />
HP 2010 targets are achieved<br />
199.0 199.0 -40 000 -24 000 -59 000 - 17 000 -24 000<br />
If<br />
all in low-risk stratum<br />
175.6 179.6 -103 000 -70 000 -160 000 - 68 000 -35 000<br />
Population systolic blood pressure in 2000 124.4 123.9<br />
I f recent trends continue to 2010<br />
125.3 128.5 (+2 000) (+1 000) (+4 000) - 6 000 (+8 000)<br />
If<br />
HP2010 targets are achieved<br />
119.4 118.9 -48 000 -39 000 -58 000 - 28 000 -20 000<br />
If<br />
all in low-risk stratum<br />
115.7 114.7 -83 000 -75 000 -108 000 - 54 000 -29 000<br />
Body mass index (BMI) in 2000 27.86 28.51<br />
If recent upward trends continue to 2010 29.18 30.16 (+8 000) (+5 000) (+11 000) (+5 000) (+3 000)<br />
If<br />
HP2010 targets are achieved<br />
25.00 26.00 -17 000 -10 000 -24 000 - 12 000 -5 000<br />
If<br />
all in low-risk stratum<br />
25.50 23.60 -21 000 -12 000 -27 000 - 10 000 -10 000<br />
Diabetes in 2000 11.7% 9.5%<br />
If recent upward trends continue to 2010 15.2% 10.1% (+16 000) (+5 000) (+22 000) (+11 000) (+5 000)<br />
If<br />
HP2010 targets are achieved<br />
6.0% 6.0% -44 000 -26 000 -66 000 - 24 000 -20 000<br />
If<br />
all in low-risk stratum<br />
0% 0%<br />
-72 000 -49 000 -100 000 - 38 000 -34 000<br />
Physical activity in 2000 75.1% 70.5%<br />
If<br />
recent trends continue to 2010<br />
80.8% 74.1% -7 000 -6 000 -9 000 - 4 000 -2 000<br />
If<br />
HP2010 targets are achieved<br />
80% 80%<br />
-12 000 -10 000 -14 000 - 6 000 -6 000<br />
If<br />
all in low-risk stratum<br />
100% 100% -34 000 -27 000 -40 000 - 18 000 -16 000<br />
If recent downward trends continue (smoking,<br />
n/a n/a -51 000 -29 000 -57 000 - 32 000 19 000<br />
cholesterol, physical inactivity male BP)<br />
If recent upward trends continue (female BP, obesity, n/a n/a (+32 000) (+10 000) (+32 000) (+16 000) (+16 000)<br />
diabetes)<br />
Net<br />
effect if recent trends continue<br />
n/a n/a<br />
-19 000 -10 000 -25 000 - 16 000 -3 000<br />
If<br />
HP2010 targets are achieved<br />
n/a n/a<br />
-188 000 -129 000 -252 000 -105 000 -83 000<br />
If<br />
all in low-risk stratum<br />
n/a n/a<br />
-372 000 -281 000 -507 000 - 230 000 -142 000<br />
If only smoking, cholesterol and BP match low-risk<br />
n/a n/a -246 000 -194 000 -339 000 - 164 000 -82 000<br />
stratum<br />
If only BMI, diabetes and physical activity match low-risk n/a n/a -126 000 -87 000 -167 000 - 66 000 -60 000<br />
stratum<br />
HP2010, Health People 2010; BP, systolic blood pressure<br />
<strong>Hospital</strong> and Healthcare Innovation Book 2009/2010 71