Imara African Cement Report Africa, the last cement frontier Angola ...
Imara African Cement Report Africa, the last cement frontier Angola ...
Imara African Cement Report Africa, the last cement frontier Angola ...

You also want an ePaper? Increase the reach of your titles
YUMPU automatically turns print PDFs into web optimized ePapers that Google loves.
Millions of Hectolitres<br />
NB<br />
Delta<br />
Cuca<br />
EABL<br />
Guinness NG<br />
Nambrew<br />
Sechaba<br />
Solibra<br />
Natbrew<br />
Zambrew<br />
SBM<br />
Guinness GN<br />
Bralirwa<br />
Per capita income US$<br />
Sechaba<br />
SABMiller<br />
Cuca<br />
Nambrew<br />
SBM<br />
Natbrew<br />
Zambrew<br />
Solibra<br />
NB<br />
Guinness NG<br />
EABL<br />
Guiness GH<br />
Delta<br />
Bralirwa<br />
Consumption in litres<br />
brewery employing 500 people and with a capacity to produce 600k HL per year. The commissioning of this brewery<br />
commenced in late 2009.<br />
Unicer: Import substitution to improve group margins<br />
Unicer is <strong>the</strong> market leader in Portugal with a market share of over half of <strong>the</strong> Portuguese market. In <strong>Africa</strong>, Unicer‟s<br />
strategy is to consolidate its position in Lusophone countries (<strong>Angola</strong>, Cape Verde, Mozambique, and Guinea Bissau),<br />
where it has a marked legacy/language advantage.<br />
On <strong>the</strong> 29th of January 2009 Unicer announced plans that it would commence <strong>the</strong> construction of a 1m HL brewery in<br />
<strong>Angola</strong> with an initial €120m investment. The group‟s application to open up a factory was initially presented in<br />
2005, however, <strong>the</strong> pre-requisite of a local partner had not been met. Three <strong>Angola</strong>n partners have since been<br />
shortlisted for this project and <strong>the</strong> brewery is expected to commence production in 2011 and is expected to reach<br />
full production by 2013/14.<br />
Table 15: Comparison of Cuca with <strong><strong>Africa</strong>n</strong> Peers<br />
Unicer is <strong>the</strong> largest Portuguese beverages exporter to <strong>Angola</strong>, representing 70% of <strong>the</strong> total beer imports into<br />
Weighted<br />
<strong>Angola</strong>. In 2009, Unicer imports into Guinness <strong>Angola</strong> Guinness reached a figure of 1.33m HL, (≈1 500 containers/month), Average of which<br />
Bralirwa Cuca Delta EABL GH NG Nambrew NB Natbrew SABMiller Sechaba SBM Solibra Zambrew (Excl. SA)<br />
1.25m HL was beer in <strong>the</strong> guise of Super Bock, Cristal and Carlsberg and <strong>the</strong> balance, was fizzy and still water under<br />
<strong>the</strong> Country„Caramulo’ Rwanda brand. <strong>Angola</strong> Zimbabwe Kenya Ghana Nigeria Namibia Nigeria Zambia South <strong>Africa</strong> Botswana Morocco Cote d'Ivoire Zambia<br />
Parent Heineken Castel SABMiller Diageo Diageo Diageo Heineken Heineken SABMiller SABMiller SABMiller Castel SABMiller<br />
Population (m) 10.1 18.3 12.5 40.0 23.8 78.0 b 2.1 78.0 b 12.9 49.1 2.0 31.9 20.6 12.9<br />
Capacity (mhl) 0.9 6.0 8.5 a 5.8 1.1 4.5 3.0 10.0 1.5 50.0<br />
c<br />
2.5 1.1 2.0 1.3<br />
Production (mhl) 0.9 8.9 5.8 a 4.7 0.9 4.2 2.0 5.0 1.5 45.3<br />
c<br />
2.4 1.1 1.8 1.0<br />
Per capita capacity (litres) 8.9 32.8 68.0 14.5 4.6 5.8 142.3 12.8 11.6 101.9 125.6 3.4 9.7 9.7 21.1<br />
Per capita cons. (litres) 8.9 59.4 46.2 11.8 3.8 5.4 94.8 6.4 11.2 92.4 119.2 3.4 8.9 7.8 14.8<br />
Per capita GDP (US$) 519.3 4,549 640.0 818 651 1,112 3,690 1,112 1,181 5,855 6,937 2,875 1,153 1,181 1,258.0<br />
Capacity Utilisation 100% 148% 68% 81% 83% 93% 67% 50% 97% 91% 95% 100% 92% 80% 71%<br />
Market Cap (LCUm) 69,942.8 n/a 944 164,481 214 360,619 1,687 698,403 437,976 57,084<br />
d<br />
1,533 3,076 127,272 964,964<br />
Market Cap (US$m) 117.4 n/a 944 1,868 134 2,308 250 4,469 91 57,084<br />
d<br />
235 363 275 200<br />
Enterprise Value/hl ($) 124 n/a 114 358 131 547 90 432 92 239<br />
d<br />
88 316 146 266 381.2<br />
Enterprise Value/EBITDA<br />
Hist 3.9 n/a 11.8 12.4 5.9 14.1 4.7 13.3 7.9 14.4 5.3 11.3 4.1 10.7 12.3<br />
T + 1 3.3 n/a 10.0 9.9 6.4 13.3 4.7 13.4 6.6 13.9 4.8 6.8 4.4 8.9 11.5<br />
T + 2 2.6 n/a 8.5 9.4 6.0 10.6 4.2 14.4 5.6 13.1 4.1 6.8 4.4 7.5 11.0<br />
Sales Growth (%)<br />
Hist 16.1 35.0 25.7 10.3 2.8 22.7 10.4 13.2 21.2 7.7 7.6 0.9 12.7 24.4 15.3<br />
T + 1 21.0 30.0 20.0 10.0 5.0 15.0 10.4 23.8 20.0 5.0 5.0 0.9 12.7 20.0 17.3<br />
T + 2 21.0 30.0 20.0 8.0 8.0 15.0 10.4 10.0 20.0 5.0 5.0 0.9 1.1 20.0 11.2<br />
PBV<br />
Hist 5.7 n/a 4.4 7.9 3.6 10.6 2.4 15.0 16.3 2.6 8.0 - 2.1 4.6 10.4<br />
T + 1 3.4 n/a 3.4 7.7 4.5 10.1 2.1 15.0 13.6 2.8 5.4 - 1.9 5.0 10.1<br />
T + 2 2.7 n/a 2.7 7.4 6.1 9.6 1.9 15.0 11.3 2.5 4.1 - 1.7 4.7 9.9<br />
Dividend Yield<br />
Hist 0.0% n/a 1.9% 3.9% 0.0% 3.1% 4.8% 4.3% 7.1% 2.3% 7.7% 0.0% 6.5% 1.9% 3.7%<br />
T + 1 1.3% n/a 1.9% 4.9% 4.5% 4.3% 5.5% 5.6% 8.5% 2.3% 8.1% 0.0% 6.6% -0.1% 4.7%<br />
T + 2 1.6% n/a 2.3% 5.1% 4.9% 5.0% 6.0% 6.1% 10.2% 2.4% 8.5% 0.0% 6.7% 1.6% 5.2%<br />
EBITDA margin (%)<br />
Hist 32.6% n/a 20.0% 34.8% 18.7% 22.7% 20.5% 29.2% 24.7% 23.0% 23.1% 27.3% 29.8% 14.8% 27.2%<br />
T + 1 33.9% n/a 19.7% 39.7% 17.9% 21.0% 20.5% 28.7% 24.5% 23.7% 23.0% 44.8% 29.6% 14.8% 28.0%<br />
T + 2 35.2% n/a 19.4% 38.7% 18.0% 22.6% 20.5% 28.6% 24.3% 24.4% 22.8% 44.8% 29.4% 14.8% 28.1%<br />
a Capacity: Lager beer: 2m HL; Sorghum/Opaque beer: 5.1m HL. Production: Beer 1.6m HL; Sorghum/Opaque 3.0m HL<br />
b Addressable population halved to reflect strong Muslim influence that has a negative effect on alcohol consumption levels<br />
c Capacity and Production figures for SA only give a feel for <strong>the</strong> potential consumption stats for <strong>the</strong> rest of <strong>Africa</strong><br />
d Based on total total SABMiller Group. Production of 270.1m HL for FY 2011; Capacity figure not available<br />
12.00<br />
10.00<br />
8.00<br />
6.00<br />
4.00<br />
2.00<br />
-<br />
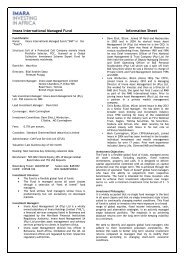
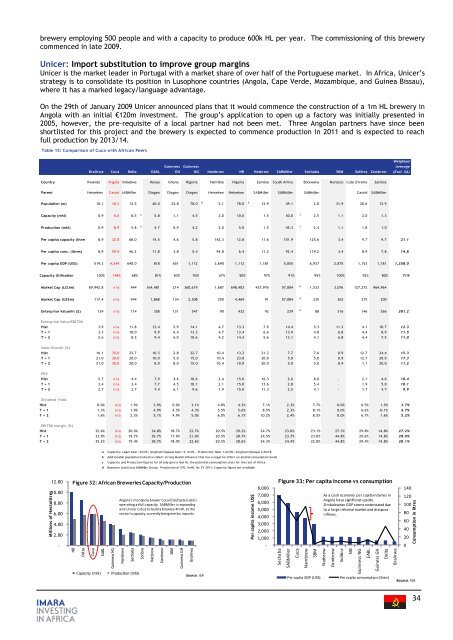
Figure 32: <strong><strong>Africa</strong>n</strong> Breweries Capacity/Production<br />
<strong>Angola</strong>'s monopoly brewer Cuca (CGI/Castel sub) is<br />
operating at full capacity. SABMiller is expanding<br />
and Unicer is due to build a brewery 4m HL to <strong>the</strong><br />
sector's capacity, currently being met by imports.<br />
8,000<br />
7,000<br />
6,000<br />
5,000<br />
4,000<br />
3,000<br />
2,000<br />
1,000<br />
-<br />
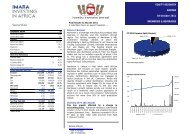
Figure 33: Per capita income vs consumption<br />
As a cash economy per capita incomes in<br />
<strong>Angola</strong> have significnat upside.<br />
Zimbabwean GDP seems understated due<br />
to a large informal market and diaspora<br />
inflows.<br />
140<br />
120<br />
100<br />
80<br />
60<br />
40<br />
20<br />
0<br />
Capacity (mhl) Production (mhl)<br />
Source: ISA<br />
Per capita GDP (US$)<br />
Per capita consumption (litres)<br />
Source: ISA<br />
34