Sub-Saharan Africa Stock Markets 2010 Review & 2011 ... - Imara
Sub-Saharan Africa Stock Markets 2010 Review & 2011 ... - Imara
Sub-Saharan Africa Stock Markets 2010 Review & 2011 ... - Imara

Create successful ePaper yourself
Turn your PDF publications into a flip-book with our unique Google optimized e-Paper software.
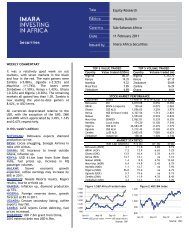
EQUITY RESEARCH<br />
KENYA<br />
FEBRUARY <strong>2011</strong><br />
<strong>2010</strong> REVIEW AND <strong>2011</strong> OUTLOOK<br />
Kenyans voted in favour of the constitutional<br />
referendum in August <strong>2010</strong>, a move that has reshaped<br />
the political landscape and should avoid a repeat of the<br />
post-election violence that claimed the lives of around<br />
1,300 people in late 2007 and early 2008. The vote<br />
also boosted investor confidence in the Kenyan<br />
economy and capital markets.<br />
In <strong>2010</strong>, Kenya collected KES 548.1bn in revenue and<br />
received KES 20.7bn in grants, giving total receipts of KES<br />
568.8bn. Total expenditures of KES 725.2bn translated<br />
into a budget deficit of 6.5% of GDP, up from 3.7% in FY<br />
2009. The Ministry of Finance expects the deficit to<br />
increase to 6.8% in FY <strong>2011</strong>, mainly due to the 50.7%<br />
increase in funds allocated to development projects.<br />
In the first half of <strong>2010</strong>, GDP growth was 5.1% and<br />
expected to be sustained at around that level for the rest<br />
of the year. The Ministry of Finance expects a 5.0%<br />
growth in real GDP in FY <strong>2010</strong>. The key drivers of growth<br />
were agriculture (due to favourable weather conditions),<br />
construction (increased investment in infrastructure),<br />
manufacturing (robust regional growth), and financial<br />
services (increased competition and new products).<br />
Tourism arrivals increased beyond the psychological 1m in<br />
<strong>2010</strong>. However due to the decline in the share of high-end<br />
tourists from the EU, net tourism revenue has not grown<br />
as rapidly as arrivals.<br />
A combination of post-election violence, drought and high<br />
international commodity prices pushed the inflation rate<br />
up to a peak of 31.5% in May 2008. However, improved<br />
food supplies, easing international oil prices and the<br />
change in the methodology of computing the CPI index<br />
from arithmetic mean to geometric mean, have all<br />
resulted in a single digit inflation figure of 4.5% in<br />
December <strong>2010</strong>.<br />
The Shilling remained relatively stable, trading in the KES<br />
80 - KES 82 per dollar range. With the widespread<br />
uncertainty in the global markets, the stability in the<br />
Shilling is encouraging and was beneficial to exporters,<br />
especially as some products (such as tea) are quoted in US<br />
dollars.<br />
Kenya has a relatively low Central Bank Rate (CBR) at<br />
5.75%, compared to regional peers. However the interest<br />
rate spread remains high at around 10%, and as a result<br />
we expect impressive results from the banking sector.<br />
Top gainers and losers <strong>2010</strong> Opening Closing % change % change<br />
Company price price (LC) (USD)<br />
NSE-20 3 247.44 4 432.60 36.50% 27.72%<br />
KenolKobil 5.00 17.00 240.00% 218.13%<br />
Kakuzi 31.75 81.50 156.69% 140.18%<br />
Eaagads 20.00 50.00 150.00% 133.92%<br />
Scangroup 25.50 61.50 141.18% 125.66%<br />
Co-op. Bank of Kenya 8.95 19.00 112.29% 98.64%<br />
B.O.C Kenya 150.00 132.00 -12.00% -17.66%<br />
E.A.Cables 20.25 16.25 -19.75% -24.91%<br />
AccessKenya Group 20.25 13.50 -33.33% -37.62%<br />
Marshalls 21.75 14.10 -35.17% -39.34%<br />
Kenya Power & Lighting 17.50 10.00 -42.86% -46.53%<br />
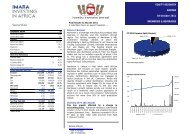
1.5<br />
1.4<br />
1.3<br />
1.2<br />
1.1<br />
1.0<br />
0.9<br />
Top 10 shares by market cap.<br />
Company KES (m) USD (m) % of total<br />
Safaricom 188,000.00 2,320.99 16.75%<br />
East <strong>Africa</strong>n Breweries 158,945.65 1,962.29 14.16%<br />
Equity Bank 99,049.29 1,222.83 8.82%<br />
Barclays Bank 84,867.75 1,047.75 7.56%<br />
Standard Chartered Bank 70,167.69 866.27 6.25%<br />
Bamburi Cement 67,873.38 837.94 6.05%<br />
Co-operative Bank of Kenya 66,485.03 820.80 5.92%<br />
KenGen 52,760.67 651.37 4.70%<br />
Kenya Commercial Bank 48,236.67 595.51 4.30%<br />
British American Tobacco Kenya 27,000.00 333.33 2.41%<br />
Jan-10<br />
NSE relative to S&P <strong>Africa</strong>n Frontier Index<br />
SEMDEX relative to the S&P <strong>Africa</strong>n Frontier index<br />
Feb-10<br />
Mar-10<br />
Apr-10<br />
NSE 20<br />
May-10<br />
Jun-10<br />
Jul-10<br />
Aug-10<br />
Sep-10<br />
Oct-10<br />
Nov-10<br />
S&P <strong>Africa</strong>n Frontier<br />
Dec-10<br />
11