Sub-Saharan Africa Stock Markets 2010 Review & 2011 ... - Imara
Sub-Saharan Africa Stock Markets 2010 Review & 2011 ... - Imara
Sub-Saharan Africa Stock Markets 2010 Review & 2011 ... - Imara

You also want an ePaper? Increase the reach of your titles
YUMPU automatically turns print PDFs into web optimized ePapers that Google loves.
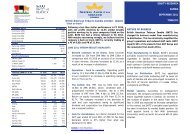
EQUITY RESEARCH<br />
ZAMBIA<br />
FEBRUARY <strong>2011</strong><br />
<strong>2010</strong> REVIEW AND <strong>2011</strong> OUTLOOK<br />
The resilience shown by the Zambian Economy to the<br />
global economic crisis saw the economy post an estimated<br />
real GDP growth rate of 7.1% in <strong>2010</strong>, marking twelve<br />
consecutive years of positive GDP growth averaging 5.12%<br />
per annum over the period. Recovery in global trade saw<br />
strong demand for commodities from India, China and<br />
Brazil. For Zambia, the key sectors expected to have<br />
driven GDP were agriculture and mining, while higher<br />
growth was also expected in the construction, transport<br />
and communication and tourism sectors. Preliminary<br />
estimates show these sectors posting growth rates of<br />
+12.9%, +16.8%, +7.2%, +14.9% and +25%, respectively.<br />
The notable attributes to growth in the named sectors<br />
were:<br />
• Bumper maize production in the agricultural<br />
sector at 2.8m metric tonnes (2009: 1.9 MT) as<br />
well as increased production from NTE’s (nontraditional<br />
exports), mainly tobacco, sugar and<br />
cotton.<br />
• The total trade surplus in year to October <strong>2010</strong><br />
was ZMK 6.2tn, up +196.7% from 2009, while total<br />
exports derived from NTE’s grew +7.6% to ZMK<br />
5.2tn. According to the <strong>2011</strong> national budget,<br />
NTE’s are expected to grow by +8.2% in <strong>2010</strong> to<br />
USD 973.7m.<br />
Top 5 Gainers and Losers - <strong>2010</strong> Opening Closing % Change % Change<br />
Company Price Price (LC) (USD)<br />
LuSE ALSI 2 794.89 3 322.47 18.88 15.03<br />
Metal Fabricators of Zambia Plc 200 600 200.00 190.29<br />
AEL Zambia Plc 1 000 1 810 81.00 75.14<br />
Zambia National Commercial Bank Plc 550 821 49.27 44.44<br />
Shoprite Holdings Ltd 21 800 32 000 46.79 42.04<br />
Copperbelt Energy Corporation Plc 430 615 43.02 38.39<br />
Zambeef Products Plc 3 800 3 700 -2.63 -5.78<br />
Zambia Bata Shoe Company Plc 90 80 -11.11 -13.94<br />
Zambia Sugar Plc 381 310 -18.64 -21.27<br />
Cavmont Capital Holdings Plc 9 4 -52.94 -54.46<br />
ZCCM Investment Holdings Plc 27 000 10 000 -62.96 -64.16<br />
Source: LuSE<br />
Top Ten Shares by Market Cap.<br />
Company (ZMK m) (USD m) % of Total<br />
Shoprite Holdings Ltd 17 391 343.00 3 618.59 56.26<br />
Zain Zambia Plc 3 692 000.00 768.19 11.94<br />
Zambia Sugar Plc 1 962 742.59 408.38 6.35<br />
Lafarge Cement Zambia Plc 1 363 271.95 283.65 4.41<br />
Standard Chartered Bank (Zambia) Plc 1 138 410.00 236.87 3.68<br />
Zambia National Commercial Bank Plc 948 255.01 197.30 3.07<br />
Zambian Breweries Plc 910 000.00 189.34 2.94<br />
ZCCM Investment Holdings Plc 892 964.28 185.80 2.89<br />
Copperbelt Energy Corporation Plc 615 000.00 127.96 1.99<br />
Zambeef Products Plc 587 212.37 122.18 1.90<br />
Source: LuSE<br />
• The <strong>2010</strong> soccer world cup in South <strong>Africa</strong> coupled<br />
with recovery in the global economy supported<br />
tourism sector growth;<br />
• Strong demand for residential and commercial<br />
properties and increased public expenditure on<br />
the road sector led to growth in the construction<br />
sector. This sector is expected to grow further on<br />
the back of various power-generation related<br />
construction<br />
works.<br />
• Reduction in call tariffs and the introduction of 3 rd<br />
generation mobile services had driven growth in<br />
the communication sector;<br />
• Increased copper production exceeding 720,000<br />
metric tonnes was on the back of buoyancy in<br />
global copper prices that averaged USD 7,567.29<br />
per metric tonne in <strong>2010</strong>. Total metal exports<br />
grew +38% to ZMK 22.4tn at October <strong>2010</strong> in<br />
comparison with 2009.<br />
Projected <strong>2011</strong> GDP growth rate is at 6.4% with key<br />
sectors such as manufacturing, transport and<br />
communication earmarked for a recovery; while continued<br />
growth is expected in construction, mining and tourism<br />
sectors.<br />
Index<br />
1.40<br />
1.35<br />
1.30<br />
1.25<br />
1.20<br />
1.15<br />
1.10<br />
1.05<br />
1.00<br />
0.95<br />
0.90<br />
LuSE relative to S&P <strong>Africa</strong>n Frontier<br />
S&P <strong>Africa</strong>n Frontier<br />
LuSE Index<br />
24