Sub-Saharan Africa Stock Markets 2010 Review & 2011 ... - Imara
Sub-Saharan Africa Stock Markets 2010 Review & 2011 ... - Imara
Sub-Saharan Africa Stock Markets 2010 Review & 2011 ... - Imara

You also want an ePaper? Increase the reach of your titles
YUMPU automatically turns print PDFs into web optimized ePapers that Google loves.
Market <strong>Review</strong> for <strong>2010</strong><br />
The LuSE All-Share Index closed <strong>2010</strong> at 3,322.47 points<br />
ending the second consecutive year of net negative FPI, a<br />
trend which continued up until July <strong>2010</strong>. Market<br />
turnover for <strong>2010</strong> was 328% higher at ZMK 962bn versus<br />
ZMK 225bn in 2009. The acquisition of Zain Zambia (listed<br />
as Celtel Zambia), triggered by a mandatory offer,<br />
accounted for 67% of total turnover in <strong>2010</strong> and<br />
contributed significantly to the net positive FPI of USD<br />
101m in <strong>2010</strong>. Hence turnover grew by 41% to ZMK 316bn<br />
on a normalised basis whilst net FPI was a negative USD<br />
10m excluding the month of December, in which the<br />
mandatory offer transaction occurred. The picture<br />
painted by <strong>2010</strong> is a lot less optimistic when turnover and<br />
net FPI numbers are normalised, and the LuSE seems to<br />
still be lagging relative to the market climate in 2008.<br />
In the broader economy, copper prices recovered in <strong>2010</strong><br />
to circa USD 9,000/tonne which in turn led to higher<br />
Zambian copper production with <strong>2010</strong> year-end<br />
production forecasts at 720,000 tonnes. FDI was forecast<br />
at USD 3bn for <strong>2010</strong> and was predominantly mining<br />
related. The second successive record bumper-harvest of<br />
2.8 million tonnes kept CPI inflation at bay with year-end<br />
CPI at a low of 7.7% y-o-y. With the Kwacha remaining in<br />
the ZMK 4,600/USD to ZMK 4,800/USD region, exports<br />
grew to ZMK 28tn as at October <strong>2010</strong> whilst imports grew<br />
to ZMK 22tn as at October <strong>2010</strong> which resulted in a trade<br />
surplus of ZMK 6tn as at October <strong>2010</strong>.<br />
The yield on 91-day treasury bills opened the year at 5.4%<br />
and reached a low of 1.9% in April <strong>2010</strong> but closed <strong>2010</strong><br />
at a 12-month high of 7.7%. Higher up the maturity<br />
spectrum, 15-year bonds declined from 18.9% in January<br />
<strong>2010</strong> to 15.4% in December <strong>2010</strong>. The net result was a<br />
flattening of the yield curve which points to expectations<br />
of slower accelerating inflation going forward. Weighted<br />
average base-lending rates by commercial banks also<br />
reduced in tandem from 22.7% in January <strong>2010</strong> to 19.4%<br />
in December <strong>2010</strong>. In <strong>2010</strong>, loans and advances by<br />
commercial banks increased by 13.8% to ZMK 9.2tn.<br />
On the LuSE, corporate restructuring activity arose from<br />
the acquisition of Zain’s <strong>Africa</strong>n assets (excluding Sudan<br />
and Morocco) by Bharti Airtel Limited; and the acquisition<br />
of BP <strong>Africa</strong> Limited by Puma Energy Holdings Limited (a<br />
subsidiary of Trafigura Beheer). During the year, the Zain<br />
acquisition triggered a mandatory offer at the country<br />
level as per the provisions of the Securities Act of the<br />
laws of Zambia governing takeovers and mergers. The<br />
acquirer offered ZMK 710 per share to minorities which<br />
resulted in Bharti Airtel Zambia Holdings (BAZH) holding<br />
96.4% of the total issued and fully paid up share capital of<br />
Zain Zambia (listed as Celtel Zambia). The LuSE has just<br />
rejected BAZH’s application to delist from the exchange,<br />
and BAZH is expected to rapply. The sale of BP <strong>Africa</strong>’s<br />
Zambian assets is currently pending.<br />
Top Most Active <strong>Stock</strong>s by Volume<br />
Company Vol. (mn) % of Total<br />
Zain Zambia Plc 1,040 71.80<br />
Investrust Bank Plc 99 6.85<br />
Zambia Sugar Plc 76 5.23<br />
Metal Fabricators of Zambia Plc 59 4.05<br />
Copperbelt Energy Corporation Plc 41 2.81<br />
Cavmont Capital Holdings Plc 33 2.25<br />
Standard Chartered Bank (Zambia) Plc 29 2.01<br />
Zambia National Commercial Bank Plc 23 1.56<br />
Zambeef Products Plc 17 1.16<br />
Zambian Breweries Plc 10 0.69<br />
Source: LuSE<br />
Top Most Active <strong>Stock</strong>s by Value<br />
Company Val. (USD) % of Total<br />
Zain Zambia Plc 150,191,789 74.35<br />
Zambeef Products Plc 12,952,170 6.41<br />
Metal Fabricators of Zambia Plc 6,822,628 3.38<br />
Shoprite Holdings Ltd 6,591,036 3.26<br />
Zambia Sugar Plc 4,974,449 2.46<br />
Copperbelt Energy Corporation Plc 4,363,312 2.16<br />
Zambian Breweries Plc 3,983,331 1.97<br />
Lafarge Cement Zambia Plc 3,353,630 1.66<br />
Zambia National Commercial Bank Plc 3,019,344 1.49<br />
Farmers House Plc 1,599,293 0.79<br />
Source: LuSE<br />
2.05%<br />
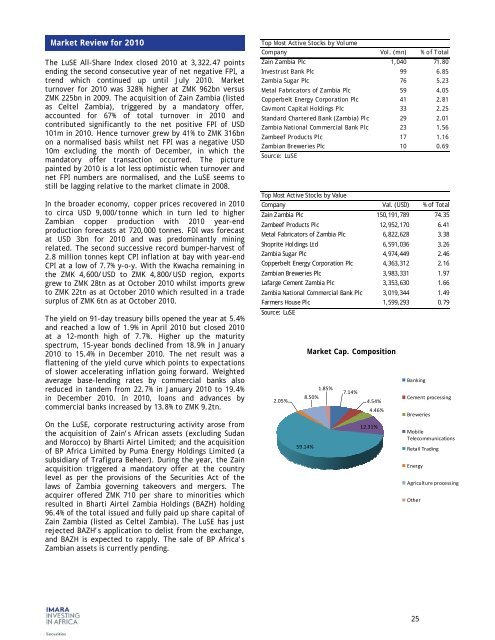
Market Cap. Composition<br />
8.50%<br />
59.14%<br />
1.85%<br />
7.14%<br />
4.54%<br />
4.46%<br />
12.31%<br />
Banking<br />
Cement processing<br />
Breweries<br />
Mobile<br />
Telecommunications<br />
Retail Trading<br />
Energy<br />
Agriculture processing<br />
Other<br />
25