Sub-Saharan Africa Stock Markets 2010 Review & 2011 ... - Imara
Sub-Saharan Africa Stock Markets 2010 Review & 2011 ... - Imara
Sub-Saharan Africa Stock Markets 2010 Review & 2011 ... - Imara

You also want an ePaper? Increase the reach of your titles
YUMPU automatically turns print PDFs into web optimized ePapers that Google loves.
EQUITY RESEARCH<br />
MALAWI<br />
FEBRUARY <strong>2011</strong><br />
<strong>2010</strong> REVIEW AND <strong>2011</strong> OUTLOOK<br />
An Overview of <strong>2010</strong><br />
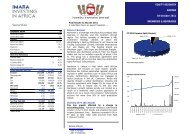
A disappointing <strong>2010</strong> as the S&P <strong>Africa</strong> Frontier Market<br />
Index outperformed the DSI. The year <strong>2010</strong> was not<br />
exciting at all on the MSE, given that the market fell to<br />
historic lows during the first half of the year. However, it<br />
was on a recovery course in the second half of <strong>2010</strong> as it<br />
registered a positive and steady growth in Q3 <strong>2010</strong> and Q4<br />
<strong>2010</strong>. In terms of trading activity, the market registered<br />
low trading volumes and value in <strong>2010</strong> compared to the year<br />
2009. In <strong>2010</strong>, a total of 241,957,941 shares were<br />
transacted at a total turnover of USD 12.36m while in 2009,<br />
the market transacted a total of 592,420,289 shares at a<br />
total turnover of USD 20.31m. This reflects a decrease in<br />
volume by 59.16 % and by 35.26% in terms of value.<br />
On a year to year basis, the DSI (that measures the average<br />
price movement of only domestic counters) yielded a return<br />
of -4.03% from 4,087.19 points to 3,922.61 points. The<br />
lowest point was registered in May when the DSI was at<br />
3,836.36 points. The MASI declined from 5,154.95 points<br />
registered at the start of January <strong>2010</strong> to 4,953.09 points<br />
registered as at 31 December, <strong>2010</strong>, giving a return of -<br />
3.92% against a return on investment of -15.37 % registered<br />
in 2009.<br />
H1 <strong>2010</strong> was more eventful. The MSE registered a strong<br />
and steady growth in the H1 <strong>2010</strong> as it transacted a total of<br />
137,449,019 shares at total turnover of (USD 7.96m) against<br />
104,508,922 shares at a total consideration of USD 4.40m)<br />
traded in H2:<strong>2010</strong>.<br />
Market Capitalisation dragged down by weaker share<br />
prices. The total market capitalisation for the MSE<br />
decreased from USD 1.38m to USD 1.37m on the back of a<br />
decrease in the share prices of some of the traded stocks<br />
such as Real Insurance, FMB, TNM, NBS and NBM which<br />
registered price decreases during the review period. Real<br />
Insurance led the decliners, as it lost 56.52% during the<br />
year.<br />
Market liquidity also worsened in <strong>2010</strong>. Generally, the<br />
main constraints with regards to frontier market investing<br />
relates to market liquidity. The MSE largely remains an<br />
illiquid market given the low turnover numbers. The<br />
turnover velocity as measured by the ratio of total value<br />
traded to market capitalisation worsened to 0.90% in <strong>2010</strong><br />
compared to 1.33% recorded in 2009. In addition, the<br />
liquidity ratio of shares traded to shares in issue declined<br />
to 1.39% in <strong>2010</strong>, compared to 3.40% in 2009. The market<br />
recorded trading activity on all counters except PIM and<br />
SUNBIRD. TNM registered the biggest trading volume of<br />
93,121,603 representing 38.49% of the total. In value terms,<br />
NBS Bank registered the biggest turnover of MWK 307.15m,<br />
representing 16.49 % of total market turnover.<br />
Top 5 Gainers and Losers Opening Closing % Change % Change<br />
Company Price Price (LC) (USD)<br />
MSE DSI 4,087.19 3,922.61 -4.03 -6.45<br />
MPICO 260 310 19.23 16.23<br />
OML 25,000 28,000 12.00 9.18<br />
Standard Bank 9,200 10,000 8.70 5.96<br />
PCL 16,300 17,000 4.29 1.67<br />
BHL 615 640 4.07 1.44<br />
NBM 5,900 5,865 -0.59 -3.10<br />
TNM 200 175 -12.50 -14.71<br />
NBS 1,400 1,100 -21.43 -23.41<br />
FMB 1,000 650 -35.00 -36.64<br />
REAL 230 100 -56.52 -57.62<br />
Source: MSE<br />
Top Ten Shares by Market Cap.<br />
Company (MWKm) (USDm) % of Total<br />
Old Mutual Plc 1,072,976.65 7,115.20 83.80<br />
Illovo 78,478.88 520.41 6.13<br />
NBM 27,374.01 181.52 2.14<br />
Standard Bank 21,333.41 141.47 1.67<br />
PCL 21,285.28 141.15 1.66<br />
TNM 17,540.79 116.32 1.37<br />
FMB 15,185.63 100.70 1.19<br />
NICO 10,951.93 72.63 0.86<br />
NBS 5,728.18 37.99 0.45<br />
MPICO 3,561.97 23.62 0.28<br />
Source: MSE<br />
DSI vs S&P <strong>Africa</strong> Frontier Market Index<br />
1.30<br />
1.20<br />
1.10<br />
1.00<br />
0.90<br />
0.80<br />
Jan-10 May-10 Aug-10 Dec-10<br />
DSI S&P Frontier Index<br />
Source: IAS<br />
13