Sub-Saharan Africa Stock Markets 2010 Review & 2011 ... - Imara
Sub-Saharan Africa Stock Markets 2010 Review & 2011 ... - Imara
Sub-Saharan Africa Stock Markets 2010 Review & 2011 ... - Imara

Create successful ePaper yourself
Turn your PDF publications into a flip-book with our unique Google optimized e-Paper software.
EQUITY RESEARCH<br />
NAMIBIA<br />
FEBRUARY <strong>2011</strong><br />
<strong>2010</strong> REVIEW AND <strong>2011</strong> OUTLOOK<br />
An Overview of <strong>2010</strong><br />
SWAPO remains firmly in power. Judging from the<br />
regional and local authority elections that took place at<br />
the end of November <strong>2010</strong>, the ruling SWAPO party<br />
continues to dominate the political space. However, the<br />
voter turnout was low as only 38% of registered voters<br />
made the effort to cast their votes. With the elections<br />
over, however, it is largely business as usual for SWAPO.<br />
In our view, the opposition needs to become a more<br />
credible force if democracy is to maintain its vibrancy and<br />
credibility with the electorate. However, the increasing<br />
popularity of the Rally for Democracy and Progress (RDP)<br />
bodes well. In addition, Namibia's constitution enshrines a<br />
multi-party system and a bill of rights. It also limits the<br />
executive president to two five-year terms and provides<br />
for the private ownership of property. Namibia has a<br />
relatively robust civil service infrastructure which it<br />
retained post-independence.<br />
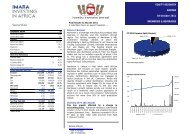
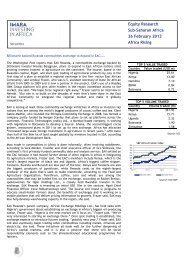
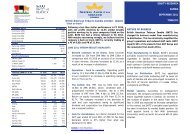
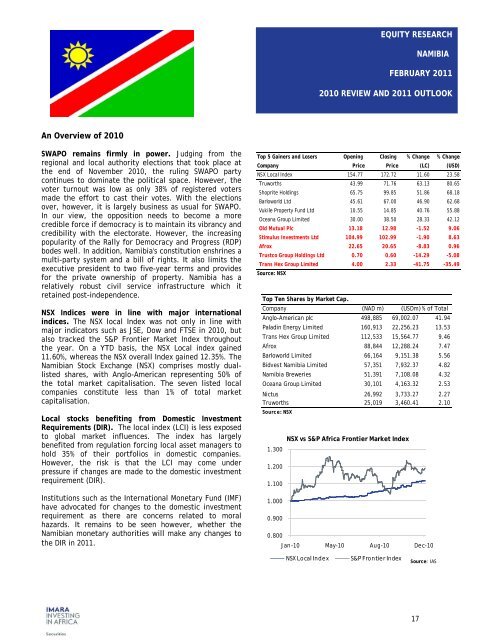
NSX Indices were in line with major international<br />
indices. The NSX local Index was not only in line with<br />
major indicators such as JSE, Dow and FTSE in <strong>2010</strong>, but<br />
also tracked the S&P Frontier Market Index throughout<br />
the year. On a YTD basis, the NSX Local index gained<br />
11.60%, whereas the NSX overall Index gained 12.35%. The<br />
Namibian <strong>Stock</strong> Exchange (NSX) comprises mostly duallisted<br />
shares, with Anglo-American representing 50% of<br />
the total market capitalisation. The seven listed local<br />
companies constitute less than 1% of total market<br />
capitalisation.<br />
Local stocks benefiting from Domestic Investment<br />
Requirements (DIR). The local index (LCI) is less exposed<br />
to global market influences. The index has largely<br />
benefited from regulation forcing local asset managers to<br />
hold 35% of their portfolios in domestic companies.<br />
However, the risk is that the LCI may come under<br />
pressure if changes are made to the domestic investment<br />
requirement (DIR).<br />
Institutions such as the International Monetary Fund (IMF)<br />
have advocated for changes to the domestic investment<br />
requirement as there are concerns related to moral<br />
hazards. It remains to be seen however, whether the<br />
Namibian monetary authorities will make any changes to<br />
the DIR in <strong>2011</strong>.<br />
Top 5 Gainers and Losers Opening Closing % Change % Change<br />
Company Price Price (LC) (USD)<br />
NSX Local Index 154.77 172.72 11.60 23.58<br />
Truworths 43.99 71.76 63.13 80.65<br />
Shoprite Holdings 65.75 99.85 51.86 68.18<br />
Barloworld Ltd 45.61 67.00 46.90 62.68<br />
Vukile Property Fund Ltd 10.55 14.85 40.76 55.88<br />
Oceana Group Limited 30.00 38.50 28.33 42.12<br />
Old Mutual Plc 13.18 12.98 -1.52 9.06<br />
Stimulus Investments Ltd 104.99 102.99 -1.90 8.63<br />
Afrox 22.65 20.65 -8.83 0.96<br />
Trustco Group Holdings Ltd 0.70 0.60 -14.29 -5.08<br />
Trans Hex Group Limited 4.00 2.33 -41.75 -35.49<br />
Source: NSX<br />
Top Ten Shares by Market Cap.<br />
Company (NAD m) (USDm) % of Total<br />
Anglo-American plc 498,885 69,002.07 41.94<br />
Paladin Energy Limited 160,913 22,256.23 13.53<br />
Trans Hex Group Limited 112,533 15,564.77 9.46<br />
Afrox 88,844 12,288.24 7.47<br />
Barloworld Limited 66,164 9,151.38 5.56<br />
Bidvest Namibia Limited 57,351 7,932.37 4.82<br />
Namibia Breweries 51,391 7,108.08 4.32<br />
Oceana Group Limited 30,101 4,163.32 2.53<br />
Nictus 26,992 3,733.27 2.27<br />
Truworths 25,019 3,460.41 2.10<br />
Source: NSX<br />
1.300<br />
1.200<br />
1.100<br />
1.000<br />
0.900<br />
0.800<br />
NSX vs S&P <strong>Africa</strong> Frontier Market Index<br />
Jan-10 May-10 Aug-10 Dec-10<br />
NSX Local Index<br />
S&P Frontier Index<br />
Source: IAS<br />
17