Sub-Saharan Africa Stock Markets 2010 Review & 2011 ... - Imara
Sub-Saharan Africa Stock Markets 2010 Review & 2011 ... - Imara
Sub-Saharan Africa Stock Markets 2010 Review & 2011 ... - Imara

You also want an ePaper? Increase the reach of your titles
YUMPU automatically turns print PDFs into web optimized ePapers that Google loves.
Market <strong>Review</strong> for <strong>2010</strong><br />
In the midst of all changes, the NSE All Share Index<br />
gained 18.93% to close at 24,770.52 in <strong>2010</strong>, (2009: -<br />
38.40%). The increase in USD terms was approximately<br />
18.16%. According to the NSE, the year opened with a<br />
reasonably bullish Q1 (+22.40%) following a reduction in<br />
deposit rates. Q2 (-1.89%) and Q3 (-9.48%) were more<br />
bearish, as counter allegations between the council and<br />
NSE executives became public and disruptive, forcing the<br />
SEC to intervene. Q4 (+7.66%) then witnessed an<br />
improvement, as the Amcon came nearer to reality and<br />
the interim executive of the NSE pursued restructuring<br />
exercises to bring back investor confidence in how the<br />
exchange was being run. Trading hours were also<br />
extended by 2 hours towards the end of Q4. Three of the<br />
four sector indices closed the year in the black, namely<br />
the Food & Beverage (+41.2%), Banking (+18.9%) and Oil &<br />
Gas (+17.8%), while the insurance sector lost 36.9%. The<br />
average market PER at the end of <strong>2010</strong> was 14.24x vs.<br />
11.46x at end 2009.<br />
Equity market capitalisation closed at NGN 7.92tn (USD<br />
51.6bn) compared with NGN 5.0tn (USD 32.8bn) in 2009.<br />
Overall equity market cap was boosted by the listing of<br />
Dangote Cement in Q4 10. The banking sector, however,<br />
remained the most capitalised, with 34.2% of equity<br />
market capitalisation, followed by the building materials<br />
sector (26.0%) and the breweries sector (11.1%).<br />
Looking at market activity, aggregate stock market<br />
turnover by volumes between January and December<br />
<strong>2010</strong> was 93.3bn shares, a 2.06% reduction, while value<br />
traded at NGN 797.6bn rose by 24.99%. In USD terms,<br />
value traded in <strong>2010</strong> equated to approximately USD 5.2bn<br />
compared with USD 4.2bn in 2009. Q2 was the most<br />
active quarter by volume and value, contributing 29.95%<br />
and 30.74% respectively to the annual totals. The most<br />
active equity sub-sectors by volume during the year were<br />
the banking, insurance, food/beverages & tobacco, ICT<br />
and mortgage companies, in that order. By value the<br />
order was banking, food/beverages & tobacco, insurance,<br />
ICT then mortgage companies. The banking sector<br />
remained the most traded, with 53.1% and 54.2% of<br />
volume and value, respectively.<br />
Foreign portfolio investment amounted to a net inflow of<br />
NGN 171.0bn (circa USD 1.1bn), with purchases<br />
amounting to NGN 350bn and sales of NGN 178.81bn. Net<br />
inflows in 2009 were recorded at NGN 33.4bn (circa USD<br />
219.2bn). Average volumes per day were 377.9m shares,<br />
while average value traded was approximately USD<br />
21.1m. Average volumes and value traded per day in 2009<br />
were 414.7m shares and USD 18.1m respectively. The<br />
liquidity ratio fell to 10.07% in <strong>2010</strong> compared with<br />
13.71% in 2009, although this will have been diluted<br />
somewhat by the increase in market cap late in the year<br />
by the Dangote Cement listing.<br />
10 Most Active <strong>Stock</strong>s by Volume<br />
Company Vol. (bn) % of Total<br />
Zenith Bank Plc 6.30 6.8<br />
First Bank of Nigeria Plc 5.44 5.8<br />
Guaranty Trust bank Plc 4.29 4.6<br />
United Bank for <strong>Africa</strong> Plc 4.25 4.6<br />
Access bank Plc 3.46 3.7<br />
FinBank Plc 3.20 3.4<br />
Skye Bank Plc 2.98 3.2<br />
Fidelity Bank Plc 2.95 3.2<br />
Diamond Bank Plc 2.78 3.0<br />
Oceanic Bank International Plc 2.05 2.2<br />
10 Most Active <strong>Stock</strong>s by Value<br />
Company<br />
Val. (USD) % of Total<br />
Zenith Bank Plc 543 741 225 10.28<br />
Guaranty Trust Bank Plc 495 522 520 9.37<br />
First Bank of Nigeria Plc 494 537 469 9.35<br />
United Bank for <strong>Africa</strong> Plc 306 851 618 5.80<br />
Oando Plc 244 641 796 4.63<br />
Nigerian Breweries Plc 233 851 559 4.42<br />
Access Bank Plc 196 641 904 3.72<br />
Diamond Bank Plc 147 648 242 2.79<br />
Skye Bank Plc 135 809 825 2.57<br />
Flour Mills Plc 124 669 174 2.36<br />
Source: NSE, Afrinvest, IAS<br />
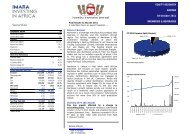
Market Cap Composition<br />
1.20% 0.70%<br />
1.90%<br />
Banking<br />
3.70%<br />
3.70% 2.40%<br />
Building Materials<br />
4.00%<br />
Breweries<br />
34.20%<br />
Food/Bev. & Tobacco<br />
11.10%<br />
Petroleum<br />
11.10%<br />
Conglomerates<br />
Foreign Listings<br />
26.00%<br />
Insurance<br />
Construction<br />
ICT<br />
Other<br />
Source: NSE<br />
20