Sub-Saharan Africa Stock Markets 2010 Review & 2011 ... - Imara
Sub-Saharan Africa Stock Markets 2010 Review & 2011 ... - Imara
Sub-Saharan Africa Stock Markets 2010 Review & 2011 ... - Imara

Create successful ePaper yourself
Turn your PDF publications into a flip-book with our unique Google optimized e-Paper software.
EQUITY RESEARCH<br />
MAURITIUS<br />
FEBRUARY <strong>2011</strong><br />
<strong>2010</strong> REVIEW AND <strong>2011</strong> OUTLOOK<br />
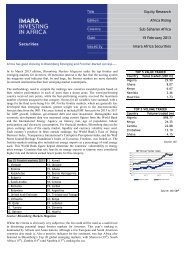
The Mauritian economy is highly dependent on Europe,<br />
which accounts for approximately 70% of its exports.<br />
The slow recovery in Europe has hampered the<br />
recovery of key industries, such as textiles. Despite the<br />
challenges it faced, the Mauritian economy grew by<br />
4.2% in <strong>2010</strong> up from the 3.1% attained in 2009.<br />
Amongst the challenges were the Greek debt crisis, the<br />
volcanic ash cloud which disrupted air travel, the<br />
unfavourable weather conditions that disrupted air<br />
travel in Europe towards the end of the year and the<br />
depreciation of the Euro against the Rupee.<br />
In <strong>2010</strong>, Mauritius had a budget deficit of 4.5% of GDP and<br />
expects this to decline to 4.3% in the <strong>2011</strong> fiscal year. In<br />
<strong>2010</strong> the government collected MUR 63bn in revenue and<br />
had current expenditures of MUR 68bn and capital<br />
expenditures of MUR 8bn. In <strong>2011</strong>, the government<br />
projects that it will collect MUR 70bn in revenue and<br />
spend MUR 84bn.<br />
Growth in GDP was mainly driven by real estate and<br />
property development, which registered growth of 6.3%,<br />
followed by transport, storage and communications at<br />
5.5% and financial services and construction which both<br />
grew by 4.3%.<br />
Despite the challenges faced by the tourism industry,<br />
tourist arrivals grew by 7.3% in <strong>2010</strong>. The GFC and the<br />
euro-zone crisis have revealed the need for Mauritius to<br />
reduce its heavy dependence on Europe. In his budget<br />
speech, Finance Minister, Pravind Kumar Jugnauth, stated<br />
that by 2015 Mauritius expects more than 50% of tourists<br />
to come from non-euro-zone countries, in contrast to the<br />
current level which is less than 40%.<br />
Inflation has declined from highs recorded in late 2008 to<br />
December’s m-o-m level of 2.9%. However, y-o-y inflation<br />
stood at 6.1%. The Monetary Policy Committee of the<br />
Central Bank has reduced the repo rate from its March<br />
2008 high of 9.5% to the current level of 4.75%. Given the<br />
likely rise in inflation due to oil prices, we do not expect<br />
to see any changes in the repo rate for at least the first<br />
half of <strong>2011</strong>.<br />
The unemployment rate reached 7.6% in Q3 <strong>2010</strong> and is<br />
estimated to have declined to 7.5% in December <strong>2010</strong>.<br />
This level is relatively low compared to regional peers and<br />
given the challenges faced by the export oriented sectors<br />
which are labour intensive.<br />
Top gainers and losers <strong>2010</strong> Opening Closing % change % change<br />
Company price price (LC) (USD)<br />
SEMDEX 1660.87 1967.45 18.46% 16.23%<br />
ENL Land 19.00 45.90 141.58% 137.03%<br />
Harel Mallac 89.00 215.00 141.57% 137.03%<br />
Swan Insurance Co. 153.00 300.00 96.08% 92.39%<br />
Mauritius Leasing Co. 4.10 8.00 95.12% 91.45%<br />
Ireland Blyth 40.50 74.00 82.72% 79.28%<br />
Automatic Systems 127.00 120.00 -5.51% -7.29%<br />
New Mauritius Hotels 134.00 110.00 -17.91% -19.45%<br />
Mauritius Stationery Manuf. 21.00 17.10 -18.57% -20.10%<br />
Sun Resorts 69.00 56.00 -18.84% -20.37%<br />
Naiade Resorts 36.00 25.50 -29.17% -30.50%<br />
Top 10 shares by market cap.<br />
Company MUR (m) USD (m) % of total<br />
Mauritius Commercial Bank 41,562.30 1,369.43 23.44%<br />
State Bank of Mauritius 27,488.50 905.72 15.51%<br />
New Mauritius Hotels 17,756.60 585.06 10.02%<br />
ENL Land 9,662.90 318.38 5.45%<br />
Harel Freres 8,451.50 278.47 4.77%<br />
Rogers & Co. 7,384.90 243.32 4.17%<br />
Sun Resorts 6,350.30 209.24 3.58%<br />
Ireland Blyth 5,286.40 174.18 2.98%<br />
Omnicane 4,958.90 163.39 2.80%<br />
Promotion and Development 4,042.10 133.18 2.28%<br />
Source: SEM<br />
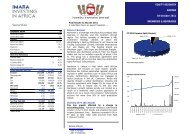
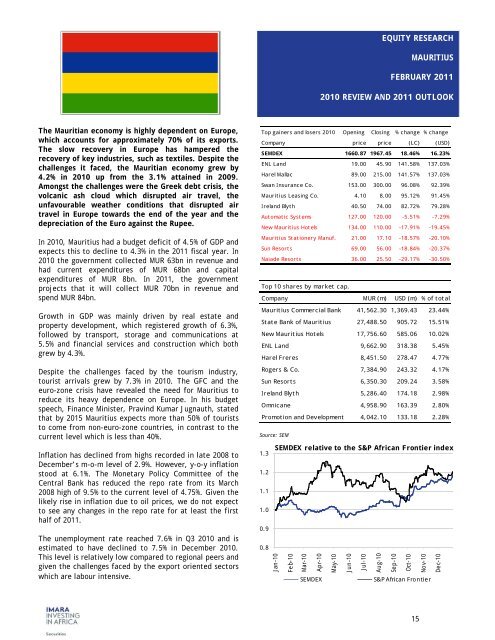
SEMDEX relative to the S&P <strong>Africa</strong>n Frontier index<br />
1.3<br />
1.2<br />
1.1<br />
1.0<br />
0.9<br />
0.8<br />
Jan-10<br />
Feb-10<br />
Mar-10<br />
Apr-10<br />
May-10<br />
Jun-10<br />
Jul-10<br />
Aug-10<br />
Sep-10<br />
Oct-10<br />
Nov-10<br />
Dec-10<br />
SEMDEX<br />
S&P <strong>Africa</strong>n Frontier<br />
15