Sub-Saharan Africa Stock Markets 2010 Review & 2011 ... - Imara
Sub-Saharan Africa Stock Markets 2010 Review & 2011 ... - Imara
Sub-Saharan Africa Stock Markets 2010 Review & 2011 ... - Imara

Create successful ePaper yourself
Turn your PDF publications into a flip-book with our unique Google optimized e-Paper software.
During the year the market had 2 new listings while 3<br />
companies delisted. Cresta and Wilderness Safaris listed<br />
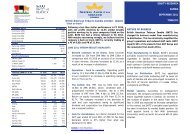
Market <strong>Review</strong> for <strong>2010</strong><br />
on the domestic board during the first quarter, while<br />
Sefcash delisted during the third quarter. On the foreign<br />
board DiamonEx was delisted after having been put under<br />
judicial management while <strong>Africa</strong>n Diamonds delisted<br />
towards the end of the year after a successful takeover<br />
by Lucara Diamonds.<br />
A NewGold ETF was listed during the second quarter,<br />
making in it the 1 st EFT to be listed on the Botswana<br />
<strong>Stock</strong> Exchange.<br />
The DCI started the year on a positive note climbing to<br />
7,702.04 points in February <strong>2010</strong> after having begun the<br />
year at 7,241.56 points. The index experienced some<br />
volatility during the Q2 <strong>2010</strong> and Q3 <strong>2010</strong> before taking a<br />
nose dive to levels last seen in July 2009 (6,400 points)<br />
driven mainly by the financial stocks. Stanchart,<br />
Barclays, and FNBB ended the year down 43.44%, 17.54%<br />
and 11.60% respectively. It was however not until<br />
December <strong>2010</strong> that the domestic index reached its<br />
lowest levels for the year at 6,368.95 points. The net<br />
result was that the DCI ended the year down 11.45% at<br />
6,412.94 points, or -8.26% in USD terms.<br />
The FCI started the year relatively flat, hovering around<br />
the 1,400 point mark. During June <strong>2010</strong> the foreign<br />
index jumped 206.13 points to close at 1,616.25 points<br />
on the back of a 5.16% gain by Discovery Metals.<br />
A total of 308.66m shares exchanged hands during the<br />
year generating a turnover of USD 149.52m. The last<br />
quarter experienced the highest level of activity with<br />
137.95m shares having been traded, generating a<br />
turnover of USD 49.85m. Letshego dominated the year’s<br />
volume and turnover with a 68.94% and 54.88%<br />
contribution respectively.<br />
10 Most Active <strong>Stock</strong>s by Volume<br />
Company<br />
Vol. (Mn) % of Total<br />
Letshego 212.80 70.26<br />
FNBB 18.91 6.24<br />
Barclays 13.14 4.34<br />
Turnstar 10.63 3.51<br />
Sechaba 10.09 3.33<br />
PrimeTime 9.58 3.16<br />
FSG 8.22 2.71<br />
BIHL 6.36 2.10<br />
ABCH 4.27 1.41<br />
Sefalana 2.96 0.98<br />
10 Most Active <strong>Stock</strong>s by Value<br />
Company<br />
Val. (USD) % of Total<br />
Letshego 80,201,630 55.61<br />
Sechaba 17,039,531 11.81<br />
Barclays 13,564,273 9.41<br />
BIHL 9,436,564 6.54<br />
FNBB 7,492,331 5.19<br />
Turnstar 2,792,749 1.94<br />
FSG 2,580,806 1.79<br />
PrimeTime 2,532,883 1.76<br />
Standard Chartered 1,972,724 1.37<br />
Sefalana 1,495,945 1.04<br />
Market Cap Composition<br />
24%<br />
10%<br />
50%<br />
Banking<br />
Property<br />
Hotel<br />
6%<br />
6%<br />
4%<br />
Brewery<br />
Financials<br />
Other<br />
4