

Download - IndexUniverse.com
Download - IndexUniverse.com
Download - IndexUniverse.com

You also want an ePaper? Increase the reach of your titles
YUMPU automatically turns print PDFs into web optimized ePapers that Google loves.
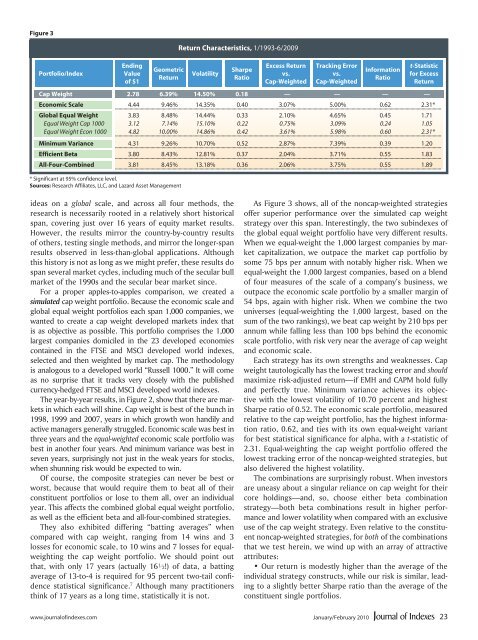
Figure 3<br />
Portfolio/Index<br />
Ending<br />
Value<br />
of $1<br />
Geometric<br />
Return<br />
* Significant at 95% confidence level.<br />
Sources: Research Affiliates, LLC, and Lazard Asset Management<br />
Return Characteristics, 1/1993-6/2009<br />
Volatility<br />
Sharpe<br />
Ratio<br />
Excess Return<br />
vs.<br />
Cap-Weighted<br />
Tracking Error<br />
vs.<br />
Cap-Weighted<br />
Information<br />
Ratio<br />
t-Statistic<br />
for Excess<br />
Return<br />
Cap Weight 2.78 6.39% 14.50% 0.18 — — — —<br />
Economic Scale 4.44 9.46% 14.35% 0.40 3.07% 5.00% 0.62 2.31*<br />
Global Equal Weight 3.83 8.48% 14.44% 0.33 2.10% 4.65% 0.45 1.71<br />
Equal Weight Cap 1000 3.12 7.14% 15.10% 0.22 0.75% 3.09% 0.24 1.05<br />
Equal Weight Econ 1000 4.82 10.00% 14.86% 0.42 3.61% 5.98% 0.60 2.31*<br />
Minimum Variance 4.31 9.26% 10.70% 0.52 2.87% 7.39% 0.39 1.20<br />
Efficient Beta 3.80 8.43% 12.81% 0.37 2.04% 3.71% 0.55 1.83<br />
All-Four-Combined 3.81 8.45% 13.18% 0.36 2.06% 3.75% 0.55 1.89<br />
ideas on a global scale, and across all four methods, the<br />
research is necessarily rooted in a relatively short historical<br />
span, covering just over 16 years of equity market results.<br />
However, the results mirror the country-by-country results<br />
of others, testing single methods, and mirror the longer-span<br />
results observed in less-than-global applications. Although<br />
this history is not as long as we might prefer, these results do<br />
span several market cycles, including much of the secular bull<br />
market of the 1990s and the secular bear market since.<br />
For a proper apples-to-apples <strong>com</strong>parison, we created a<br />
simulated cap weight portfolio. Because the economic scale and<br />
global equal weight portfolios each span 1,000 <strong>com</strong>panies, we<br />
wanted to create a cap weight developed markets index that<br />
is as objective as possible. This portfolio <strong>com</strong>prises the 1,000<br />
largest <strong>com</strong>panies domiciled in the 23 developed economies<br />
contained in the FTSE and MSCI developed world indexes,<br />
selected and then weighted by market cap. The methodology<br />
is analogous to a developed world “Russell 1000.” It will <strong>com</strong>e<br />
as no surprise that it tracks very closely with the published<br />
currency-hedged FTSE and MSCI developed world indexes.<br />
The year-by-year results, in Figure 2, show that there are markets<br />
in which each will shine. Cap weight is best of the bunch in<br />
1998, 1999 and 2007, years in which growth won handily and<br />
active managers generally struggled. Economic scale was best in<br />
three years and the equal-weighted economic scale portfolio was<br />
best in another four years. And minimum variance was best in<br />
seven years, surprisingly not just in the weak years for stocks,<br />
when shunning risk would be expected to win.<br />
Of course, the <strong>com</strong>posite strategies can never be best or<br />
worst, because that would require them to beat all of their<br />
constituent portfolios or lose to them all, over an individual<br />
year. This affects the <strong>com</strong>bined global equal weight portfolio,<br />
as well as the efficient beta and all-four-<strong>com</strong>bined strategies.<br />
They also exhibited differing “batting averages” when<br />
<strong>com</strong>pared with cap weight, ranging from 14 wins and 3<br />
losses for economic scale, to 10 wins and 7 losses for equalweighting<br />
the cap weight portfolio. We should point out<br />
that, with only 17 years (actually 16½!) of data, a batting<br />
average of 13-to-4 is required for 95 percent two-tail confidence<br />
statistical significance. 7 Although many practitioners<br />
think of 17 years as a long time, statistically it is not.<br />
As Figure 3 shows, all of the noncap-weighted strategies<br />
offer superior performance over the simulated cap weight<br />
strategy over this span. Interestingly, the two subindexes of<br />
the global equal weight portfolio have very different results.<br />
When we equal-weight the 1,000 largest <strong>com</strong>panies by market<br />
capitalization, we outpace the market cap portfolio by<br />
some 75 bps per annum with notably higher risk. When we<br />
equal-weight the 1,000 largest <strong>com</strong>panies, based on a blend<br />
of four measures of the scale of a <strong>com</strong>pany’s business, we<br />
outpace the economic scale portfolio by a smaller margin of<br />
54 bps, again with higher risk. When we <strong>com</strong>bine the two<br />
universes (equal-weighting the 1,000 largest, based on the<br />
sum of the two rankings), we beat cap weight by 210 bps per<br />
annum while falling less than 100 bps behind the economic<br />
scale portfolio, with risk very near the average of cap weight<br />
and economic scale.<br />
Each strategy has its own strengths and weaknesses. Cap<br />
weight tautologically has the lowest tracking error and should<br />
maximize risk-adjusted return—if EMH and CAPM hold fully<br />
and perfectly true. Minimum variance achieves its objective<br />
with the lowest volatility of 10.70 percent and highest<br />
Sharpe ratio of 0.52. The economic scale portfolio, measured<br />
relative to the cap weight portfolio, has the highest information<br />
ratio, 0.62, and ties with its own equal-weight variant<br />
for best statistical significance for alpha, with a t-statistic of<br />
2.31. Equal-weighting the cap weight portfolio offered the<br />
lowest tracking error of the noncap-weighted strategies, but<br />
also delivered the highest volatility.<br />
The <strong>com</strong>binations are surprisingly robust. When investors<br />
are uneasy about a singular reliance on cap weight for their<br />
core holdings—and, so, choose either beta <strong>com</strong>bination<br />
strategy—both beta <strong>com</strong>binations result in higher performance<br />
and lower volatility when <strong>com</strong>pared with an exclusive<br />
use of the cap weight strategy. Even relative to the constituent<br />
noncap-weighted strategies, for both of the <strong>com</strong>binations<br />
that we test herein, we wind up with an array of attractive<br />
attributes:<br />
• Our return is modestly higher than the average of the<br />
individual strategy constructs, while our risk is similar, leading<br />
to a slightly better Sharpe ratio than the average of the<br />
constituent single portfolios.<br />
www.journalofindexes.<strong>com</strong> January/February 2010 23


