

Download - IndexUniverse.com
Download - IndexUniverse.com
Download - IndexUniverse.com

Create successful ePaper yourself
Turn your PDF publications into a flip-book with our unique Google optimized e-Paper software.
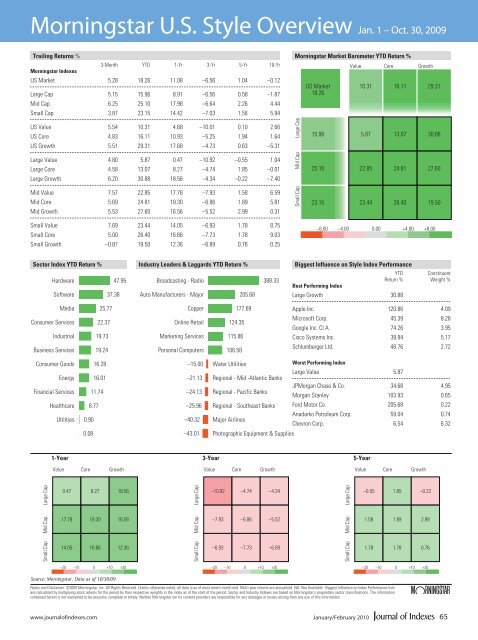
Morningstar U.S. Style Overview Jan. 1 – Oct. 30, 2009<br />
Trailing Returns %<br />
3-Month YTD 1-Yr 3-Yr 5-Yr 10-Yr<br />
Morningstar Indexes<br />
US Market 5.28 18.26 11.08 –6.56 1.04 –0.12<br />
Large Cap 5.15 15.96 8.91 –6.56 0.58 –1.87<br />
Mid Cap 6.25 25.10 17.98 –6.64 2.26 4.44<br />
Small Cap 3.87 23.15 14.42 –7.03 1.56 5.94<br />
US Value 5.54 10.31 4.68 –10.01 0.10 2.66<br />
US Core 4.83 16.11 10.93 –5.25 1.94 1.64<br />
US Growth 5.51 29.31 17.68 –4.73 0.63 –5.31<br />
Morningstar Market Barometer YTD Return %<br />
Large Cap<br />
US Market<br />
18.26<br />
15.96<br />
Value<br />
10.31<br />
Core<br />
16.11<br />
Growth<br />
29.31<br />
5.87 13.07 30.88<br />
Large Value 4.80 5.87 0.47 –10.92 –0.55 1.04<br />
Large Core 4.58 13.07 8.27 –4.74 1.85 –0.01<br />
Large Growth 6.20 30.88 18.56 –4.34 –0.22 –7.40<br />
Mid Cap<br />
25.10<br />
22.85 24.81 27.60<br />
Mid Value 7.57 22.85 17.78 –7.93 1.58 6.59<br />
Mid Core 5.69 24.81 19.30 –6.86 1.89 5.81<br />
Mid Growth 5.53 27.60 16.56 –5.52 2.99 0.31<br />
Small Cap<br />
23.15<br />
23.44 26.40 19.50<br />
Small Value 7.69 23.44 14.05 –6.93 1.78 8.75<br />
Small Core 5.00 26.40 16.66 –7.73 1.78 9.03<br />
Small Growth –0.87 19.50 12.36 –6.89 0.76 0.25<br />
–8.00 –4.00 0.00 +4.00 +8.00<br />
Sector Index YTD Return %<br />
Hardware 47.95<br />
Software 37.38<br />
Industry Leaders & Laggards YTD Return %<br />
Broadcasting - Radio 388.33<br />
Auto Manufacturers - Major 205.68<br />
Biggest Influence on Style Index Performance<br />
Best Performing Index<br />
YTD<br />
Return %<br />
Large Growth 30.88<br />
Constituent<br />
Weight %<br />
Media 25.77<br />
Consumer Services 22.37<br />
Industrial 19.73<br />
Business Services 19.24<br />
Copper 177.69<br />
Online Retail 124.35<br />
Marketing Services 115.86<br />
Personal Computers 106.58<br />
Apple Inc. 120.86 4.09<br />
Microsoft Corp. 45.39 8.28<br />
Google Inc. Cl A 74.26 3.95<br />
Cisco Systems Inc. 39.94 5.17<br />
Schlumberger Ltd. 48.76 2.72<br />
Consumer Goods 16.28<br />
Energy 16.01<br />
Financial Services 11.74<br />
Healthcare 8.77<br />
Utilities 0.90<br />
0.08<br />
–15.00 Water Utilities<br />
Worst Performing Index<br />
Large Value 5.87<br />
–21.13 Regional - Mid -Atlantic Banks<br />
JPMorgan Chase & Co. 34.68 4.95<br />
–24.13 Regional - Pacific Banks<br />
Morgan Stanley 103.93 0.65<br />
–25.96 Regional - Southeast Banks Ford Motor Co. 205.68 0.22<br />
–40.32 Major Airlines<br />
Anadarko Petroleum Corp. 59.04 0.74<br />
Chevron Corp. 6.54 6.32<br />
–43.01 Photographic Equipment & Supplies<br />
1-Year<br />
3-Year<br />
5-Year<br />
Value<br />
Core<br />
Growth<br />
Value<br />
Core<br />
Growth<br />
Value<br />
Core<br />
Growth<br />
Large Cap<br />
0.47<br />
8.27<br />
18.56<br />
Large Cap<br />
–10.92<br />
–4.74<br />
–4.34<br />
Large Cap<br />
–0.55<br />
1.85<br />
–0.22<br />
Mid Cap<br />
17.78<br />
19.30 16.56<br />
Mid Cap<br />
–7.93<br />
–6.86 –5.52<br />
Mid Cap<br />
1.58<br />
1.89 2.99<br />
Small Cap<br />
14.05<br />
16.66 12.36<br />
Small Cap<br />
–6.93<br />
–7.73 –6.89<br />
Small Cap<br />
1.78<br />
1.78 0.76<br />
–20 –10 0 +10 +20<br />
–20 –10 0 +10 +20<br />
–20 –10 0 +10 +20<br />
Source: Morningstar. Data as of 10/30/09<br />
Source: Morningstar. Data as of 2/29/08<br />
Notes and Disclaimer: ©2009 Morningstar, Inc. All Rights Reserved. Unless otherwise noted, all data is as of most recent month end. Multi-year returns are annualized. NA: Not Available. Biggest Influence on Index Performance lists<br />
are calculated by multiplying stock returns for the period by their respective weights in the index as of the start of the period. Sector and Industry Indexes are based on Morningstar's proprietary sector classifications. The information ?<br />
contained herein is not warranted to be accurate, <strong>com</strong>plete or timely. Neither Morningstar nor its content providers are responsible for any damages or losses arising from any use of this information.<br />
www.journalofindexes.<strong>com</strong><br />
January/February 2010<br />
65


