

Download - IndexUniverse.com
Download - IndexUniverse.com
Download - IndexUniverse.com

Create successful ePaper yourself
Turn your PDF publications into a flip-book with our unique Google optimized e-Paper software.
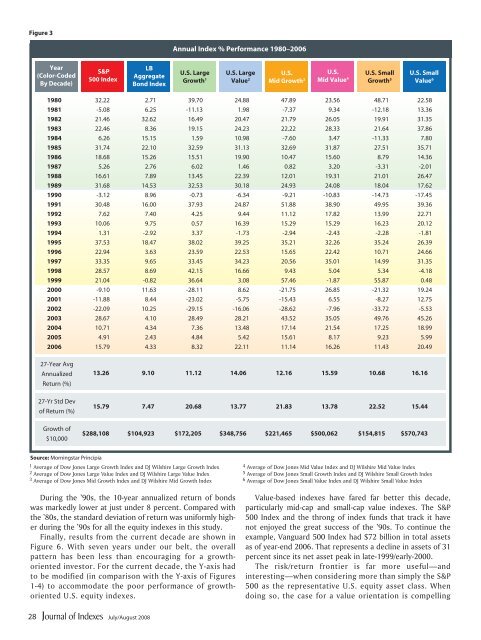
Figure 3<br />
Annual Index % Performance 1980–2006<br />
Year<br />
(Color-Coded<br />
By Decade)<br />
S&P<br />
500 Index<br />
LB<br />
Aggregate<br />
Bond Index<br />
U.S. Large<br />
Growth 1<br />
U.S. Large<br />
Value 2<br />
U.S.<br />
Mid Growth 3<br />
U.S.<br />
Mid Value 4<br />
U.S. Small<br />
Growth 5<br />
U.S. Small<br />
Value 6<br />
1980 32.22 2.71 39.70 24.88 47.89 23.56 48.71 22.58<br />
1981 -5.08 6.25 -11.13 1.98 -7.37 9.34 -12.18 13.36<br />
1982 21.46 32.62 16.49 20.47 21.79 26.05 19.91 31.35<br />
1983 22.46 8.36 19.15 24.23 22.22 28.33 21.64 37.86<br />
1984 6.26 15.15 1.59 10.98 -7.60 3.47 -11.33 7.80<br />
1985 31.74 22.10 32.59 31.13 32.69 31.87 27.51 35.71<br />
1986 18.68 15.26 15.51 19.90 10.47 15.60 8.79 14.36<br />
1987 5.26 2.76 6.02 1.46 0.82 3.20 -3.31 -2.01<br />
1988 16.61 7.89 13.45 22.39 12.01 19.31 21.01 26.47<br />
1989 31.68 14.53 32.53 30.18 24.93 24.08 18.04 17.62<br />
1990 -3.12 8.96 -0.73 -6.34 -9.21 -10.83 -14.73 -17.45<br />
1991 30.48 16.00 37.93 24.87 51.88 38.90 49.95 39.36<br />
1992 7.62 7.40 4.25 9.44 11.12 17.82 13.99 22.71<br />
1993 10.06 9.75 0.57 16.39 15.29 15.29 16.23 20.12<br />
1994 1.31 -2.92 3.37 -1.73 -2.94 -2.43 -2.28 -1.81<br />
1995 37.53 18.47 38.02 39.25 35.21 32.26 35.24 26.39<br />
1996 22.94 3.63 23.59 22.53 15.65 22.42 10.71 24.66<br />
1997 33.35 9.65 33.45 34.23 20.56 35.01 14.99 31.35<br />
1998 28.57 8.69 42.15 16.66 9.43 5.04 5.34 -4.18<br />
1999 21.04 -0.82 36.64 3.08 57.46 -1.87 55.87 0.48<br />
2000 -9.10 11.63 -28.11 8.62 -21.75 26.85 -21.32 19.24<br />
2001 -11.88 8.44 -23.02 -5.75 -15.43 6.55 -8.27 12.75<br />
2002 -22.09 10.25 -29.15 -16.06 -28.62 -7.96 -33.72 -5.53<br />
2003 28.67 4.10 28.49 28.21 43.52 35.05 49.76 45.26<br />
2004 10.71 4.34 7.36 13.48 17.14 21.54 17.25 18.99<br />
2005 4.91 2.43 4.84 5.42 15.61 8.17 9.23 5.99<br />
2006 15.79 4.33 8.32 22.11 11.14 16.26 11.43 20.49<br />
27-Year Avg<br />
Annualized<br />
Return (%)<br />
13.26 9.10 11.12 14.06 12.16 15.59 10.68 16.16<br />
27-Yr Std Dev<br />
of Return (%)<br />
15.79 7.47 20.68 13.77 21.83 13.78 22.52 15.44<br />
Growth of<br />
$10,000<br />
$288,108 $104,923 $172,205 $348,756 $221,465 $500,062 $154,815 $570,743<br />
Source: Morningstar Principia<br />
1 Average of Dow Jones Large Growth Index and DJ Wilshire Large Growth Index<br />
2 Average of Dow Jones Large Value Index and DJ Wilshire Large Value Index<br />
3 Average of Dow Jones Mid Growth Index and DJ Wilshire Mid Growth Index<br />
4 Average of Dow Jones Mid Value Index and DJ Wilshire Mid Value Index<br />
5 Average of Dow Jones Small Growth Index and DJ Wilshire Small Growth Index<br />
6 Average of Dow Jones Small Value Index and DJ Wilshire Small Value Index<br />
During the ’90s, the 10-year annualized return of bonds<br />
was markedly lower at just under 8 percent. Compared with<br />
the ’80s, the standard deviation of return was uniformly higher<br />
during the ’90s for all the equity indexes in this study.<br />
Finally, results from the current decade are shown in<br />
Figure 6. With seven years under our belt, the overall<br />
pattern has been less than encouraging for a growthoriented<br />
investor. For the current decade, the Y-axis had<br />
to be modified (in <strong>com</strong>parison with the Y-axis of Figures<br />
1-4) to ac<strong>com</strong>modate the poor performance of growthoriented<br />
U.S. equity indexes.<br />
Value-based indexes have fared far better this decade,<br />
particularly mid-cap and small-cap value indexes. The S&P<br />
500 Index and the throng of index funds that track it have<br />
not enjoyed the great success of the ’90s. To continue the<br />
example, Vanguard 500 Index had $72 billion in total assets<br />
as of year-end 2006. That represents a decline in assets of 31<br />
percent since its net asset peak in late-1999/early-2000.<br />
The risk/return frontier is far more useful—and<br />
interesting—when considering more than simply the S&P<br />
500 as the representative U.S. equity asset class. When<br />
doing so, the case for a value orientation is <strong>com</strong>pelling<br />
28<br />
July/August 2008


