

Download - IndexUniverse.com
Download - IndexUniverse.com
Download - IndexUniverse.com

You also want an ePaper? Increase the reach of your titles
YUMPU automatically turns print PDFs into web optimized ePapers that Google loves.
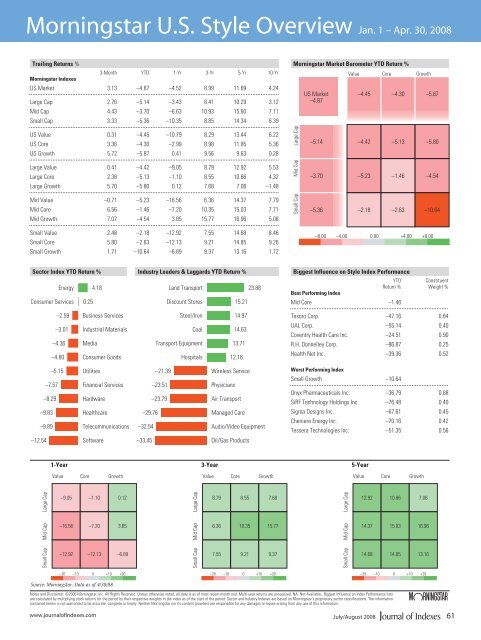
Morningstar U.S. Style Overview Jan. 1 – Apr. 30, 2008<br />
Morningstar U.S. Style Overview: January 1 - April 30, 2008<br />
Trailing Returns %<br />
3-Month YTD 1-Yr 3-Yr 5-Yr 10-Yr<br />
Morningstar Indexes<br />
US Market 3.13 –4.87 –4.52 8.99 11.69 4.24<br />
Large Cap 2.76 –5.14 –3.43 8.41 10.29 3.12<br />
Mid Cap 4.43 –3.70 –6.63 10.93 15.60 7.11<br />
Small Cap 3.33 –5.36 –10.35 8.85 14.34 6.39<br />
US Value 0.31 –4.45 –10.79 8.29 13.44 6.22<br />
US Core 3.36 –4.30 –2.99 8.98 11.85 5.36<br />
US Growth 5.72 –5.87 0.41 9.56 9.63 0.28<br />
Morningstar Market Barometer YTD Return %<br />
Large Cap<br />
US Market<br />
–4.87<br />
–5.14<br />
Value<br />
–4.45<br />
Core<br />
–4.30<br />
Growth<br />
–5.87<br />
–4.42 –5.13 –5.80<br />
Large Value 0.41 –4.42 –9.05 8.79 12.92 5.53<br />
Large Core 2.38 –5.13 –1.10 8.55 10.66 4.32<br />
Large Growth 5.70 –5.80 0.12 7.68 7.06 –1.48<br />
Mid Cap<br />
–3.70<br />
–5.23 –1.46 –4.54<br />
Mid Value –0.71 –5.23 –16.56 6.36 14.37 7.79<br />
Mid Core 6.56 –1.46 –7.20 10.35 15.03 7.71<br />
Mid Growth 7.07 –4.54 3.85 15.77 16.96 5.08<br />
Small Cap<br />
–5.36<br />
–2.18 –2.63 –10.64<br />
Small Value 2.48 –2.18 –12.92 7.55 14.68 8.46<br />
Small Core 5.80 –2.63 –12.13 9.21 14.85 9.26<br />
Small Growth 1.71 –10.64 –6.89 9.37 13.16 1.72<br />
–8.00 –4.00 0.00 +4.00 +8.00<br />
Sector Index YTD Return %<br />
Energy 4.18<br />
Consumer Services 0.25<br />
Industry Leaders & Laggards YTD Return %<br />
Land Transport 23.88<br />
Discount Stores 15.21<br />
Biggest Influence on Style Index Performance<br />
Best Performing Index<br />
YTD<br />
Return %<br />
Mid Core –1.46<br />
Constituent<br />
Weight %<br />
–2.59 Business Services<br />
–3.01 Industrial Materials<br />
–4.36 Media<br />
–4.80 Consumer Goods<br />
–5.15 Utilities<br />
–7.57 Financial Services<br />
–8.29 Hardware<br />
–9.83 Healthcare<br />
–9.89 Tele<strong>com</strong>munications<br />
–12.54 Software<br />
Steel/Iron 14.97<br />
Coal 14.63<br />
Transport Equipment 13.71<br />
Hospitals 12.16<br />
–21.39 Wireless Service<br />
–23.51 Physicians<br />
–23.79 Air Transport<br />
–29.76 Managed Care<br />
–32.54 Audio/Video Equipment<br />
–33.45 Oil/Gas Products<br />
Tesoro Corp. –47.16 0.64<br />
UAL Corp. –55.14 0.40<br />
Coventry Health Care Inc. –24.51 0.90<br />
R.H. Donnelley Corp. –86.87 0.25<br />
Health Net Inc. –39.36 0.52<br />
Worst Performing Index<br />
Small Growth –10.64<br />
Onyx Pharmaceuticals Inc. –36.79 0.88<br />
SiRF Technology Holdings Inc. –76.48 0.40<br />
Sigma Designs Inc. –67.61 0.45<br />
Cheniere Energy Inc. –70.16 0.42<br />
Tessera Technologies Inc. –51.35 0.56<br />
1-Year<br />
3-Year<br />
5-Year<br />
Value<br />
Core<br />
Growth<br />
Value<br />
Core<br />
Growth<br />
Value<br />
Core<br />
Growth<br />
Large Cap<br />
–9.05<br />
–1.10<br />
0.12<br />
Large Cap<br />
8.79<br />
8.55<br />
7.68<br />
Large Cap<br />
12.92<br />
10.66<br />
7.06<br />
Mid Cap<br />
–16.56<br />
–7.20 3.85<br />
Mid Cap<br />
6.36<br />
10.35 15.77<br />
Mid Cap<br />
14.37<br />
15.03 16.96<br />
Small Cap<br />
–12.92<br />
–12.13 –6.89<br />
Small Cap<br />
7.55<br />
9.21 9.37<br />
Small Cap<br />
14.68<br />
14.85 13.16<br />
–20 –10 0 +10 +20<br />
–20 –10 0 +10 +20<br />
–20 –10 0 +10 +20<br />
Source: Morningstar. Data as of 4/30/08<br />
Notes and Disclaimer: ©2006 Morningstar, Inc. All Rights Reserved. Unless otherwise noted, all data is as of most recent month end. Multi-year returns are annualized. NA: Not Available. Biggest Influence on Index Performance lists<br />
are calculated by multiplying stock returns for the period by their respective weights in the index as of the start of the period. Sector and Industry Indexes are based on Morningstar's proprietary sector classifications. The information ?<br />
contained herein is not warranted to be accurate, <strong>com</strong>plete or timely. Neither Morningstar nor its content providers are responsible for any damages or losses arising from any use of this information.<br />
www.journalofindexes.<strong>com</strong><br />
July/August 2008<br />
61


