

Download - IndexUniverse.com
Download - IndexUniverse.com
Download - IndexUniverse.com

Create successful ePaper yourself
Turn your PDF publications into a flip-book with our unique Google optimized e-Paper software.
liquidity of the underlying <strong>com</strong>ponents that really matters.<br />
S&P 500 Example<br />
Consider, for instance, the S&P 500 SPDR (SPY) and the<br />
RevenueShares Large-Cap ETF (RWL). Both funds hold the<br />
exact same stocks—all 500 <strong>com</strong>ponents of the S&P 500. The<br />
only difference is that SPY weights those <strong>com</strong>ponents by market<br />
cap, while RWL weights them by revenues.<br />
That shouldn’t impact the liquidity of the underlying, as all<br />
500 stocks in the S&P 500 are deeply liquid.<br />
When you look at the spreads data, however, there’s no<br />
<strong>com</strong>parison. For the time period studied, SPY had spreads<br />
of less than 0.01 percent, while RWL’s spread averaged 0.9<br />
percent—90 times wider.<br />
SPY, of course, is the largest ETF in the world, with over<br />
$70 billion in assets; RWL is a newly launched fund, with little<br />
in the way of assets or trading interest so far.<br />
Muni Bond Example<br />
Another example <strong>com</strong>es from the muni bond space. The muni<br />
bond market is notoriously illiquid, and different ETF providers<br />
take different approaches to handling this illiquidity.<br />
Both BGI and SSgA offer broad-market, nationally oriented<br />
muni bond funds. The two funds—the iShares S&P<br />
National Municipal Bond ETF (MUB) and the SPDR Lehman<br />
Municipal Bond ETF (TFI)—hold roughly equivalent portfolios<br />
with roughly equivalent returns. But they have very<br />
different creation methodologies.<br />
In MUB, APs must go out into the market and buy specific<br />
bonds in order to create new shares. Even though iShares designs<br />
these creation baskets to hold only the most liquid muni bonds,<br />
it is still a hurdle that APs must negotiate to create new shares.<br />
TFI, by contrast, uses what’s called a “cash creation basket.”<br />
In other words, the only thing APs have to do to create<br />
new shares is send cash to SSgA. It couldn’t be easier.<br />
However, for the time period studied, MUB had much tighter<br />
spreads (0.10 percent) <strong>com</strong>pared with TFI (0.30 percent). The reason?<br />
MUB is a larger fund with more inherent trading volume.<br />
It’s interesting to note that the spreads on TFI have shrunk<br />
as the fund has grown. As of early May, TFI had more than<br />
$250 million in assets and higher trading activity, and from<br />
May 1 through May 15, 2008, the average spread on the fund<br />
was down to 0.20 percent. As the fund continues to grow, its<br />
spreads will likely continue to narrow.<br />
Conclusion<br />
Spreads aren’t as simple as ETF proponents make them<br />
out to be. Most ETFs have tight spreads, but not all of<br />
them do, and spreads represent a real cost to investors.<br />
Especially for newer ETFs with low assets under management,<br />
investors would do well to pay attention to spreads<br />
when they trade, and use limit orders to avoid paying too<br />
much above fair value.<br />
Spreads should be incorporated into every ETF trading<br />
decision, much the way that brokerage <strong>com</strong>missions are.<br />
Their impact will be felt most by short-term traders, but even<br />
long-term investors should consider their planned holding<br />
period and incorporate spreads into their trading decisions.<br />
[This article expands on an article published in the May<br />
2008 issue of the Exchange-Traded Funds Report.]<br />
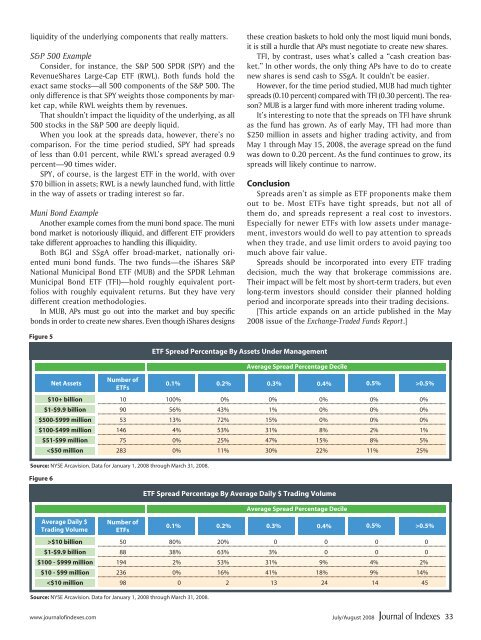
Figure 5<br />
Net Assets<br />
Number of<br />
ETFs<br />
Source: NYSE Arcavision. Data for January 1, 2008 through March 31, 2008.<br />
ETF Spread Percentage By Assets Under Management<br />
Average Spread Percentage Decile<br />
0.1% 0.2% 0.3% 0.4% 0.5%<br />
$10+ billion 10 100% 0% 0% 0% 0% 0%<br />
$1-$9.9 billion 90 56% 43% 1% 0% 0% 0%<br />
$500-$999 million 53 13% 72% 15% 0% 0% 0%<br />
$100-$499 million 146 4% 53% 31% 8% 2% 1%<br />
Figure 6<br />
$51-$99 million 75 0% 25% 47% 15% 8% 5%<br />
$10 billion 50 80% 20% 0 0 0 0<br />
$1-$9.9 billion 88 38% 63% 3% 0 0 0<br />
$100 - $999 million 194 2% 53% 31% 9% 4% 2%<br />
$10 - $99 million 236 0% 16% 41% 18% 9% 14%<br />
0.5%<br />
>0.5%<br />
www.journalofindexes.<strong>com</strong> July/August 2008<br />
33


