

Download - IndexUniverse.com
Download - IndexUniverse.com
Download - IndexUniverse.com

You also want an ePaper? Increase the reach of your titles
YUMPU automatically turns print PDFs into web optimized ePapers that Google loves.
Figure 2<br />
Figure 3<br />
463<br />
134<br />
ETF Spreads<br />
55<br />
14<br />
$0.01-$0.10 $0.11-$0.20 $0.21-$0.50 $0.51+<br />
Average Spreads<br />
Source: NYSE Arcavision. Data for January 1, 2008 through March 31, 2008.<br />
500<br />
450<br />
400<br />
350<br />
300<br />
250<br />
200<br />
150<br />
100<br />
50<br />
0<br />
that’s not really what investors paid. A spot check on April 18<br />
showed the bid/ask spread at $0.80; still high, but well below<br />
the artificial $10.99 figure.<br />
Number of ETFs<br />
74<br />
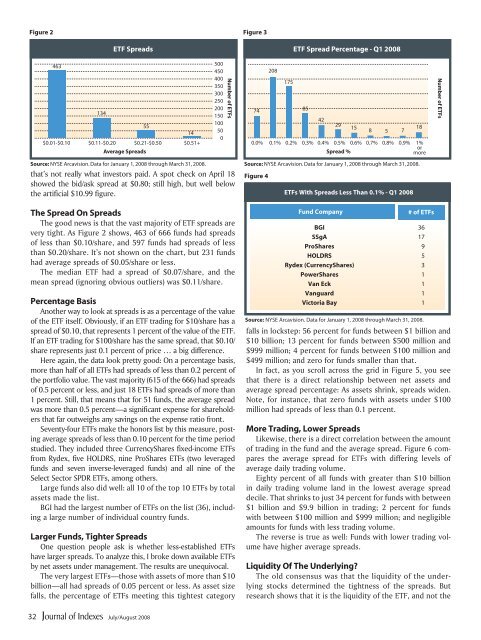
208<br />
175<br />
ETF Spread Percentage - Q1 2008<br />
85<br />
42<br />
Source: NYSE Arcavision. Data for January 1, 2008 through March 31, 2008.<br />
29<br />
15<br />
8 5 7<br />
0.0% 0.1% 0.2% 0.3% 0.4% 0.5% 0.6% 0.7% 0.8% 0.9% 1%<br />
or<br />
Spread %<br />
more<br />
Figure 4<br />
ETFs With Spreads Less Than 0.1% - Q1 2008<br />
18<br />
Number of ETFs<br />
The Spread On Spreads<br />
The good news is that the vast majority of ETF spreads are<br />
very tight. As Figure 2 shows, 463 of 666 funds had spreads<br />
of less than $0.10/share, and 597 funds had spreads of less<br />
than $0.20/share. It’s not shown on the chart, but 231 funds<br />
had average spreads of $0.05/share or less.<br />
The median ETF had a spread of $0.07/share, and the<br />
mean spread (ignoring obvious outliers) was $0.11/share.<br />
Percentage Basis<br />
Another way to look at spreads is as a percentage of the value<br />
of the ETF itself. Obviously, if an ETF trading for $10/share has a<br />
spread of $0.10, that represents 1 percent of the value of the ETF.<br />
If an ETF trading for $100/share has the same spread, that $0.10/<br />
share represents just 0.1 percent of price … a big difference.<br />
Here again, the data look pretty good: On a percentage basis,<br />
more than half of all ETFs had spreads of less than 0.2 percent of<br />
the portfolio value. The vast majority (615 of the 666) had spreads<br />
of 0.5 percent or less, and just 18 ETFs had spreads of more than<br />
1 percent. Still, that means that for 51 funds, the average spread<br />
was more than 0.5 percent—a significant expense for shareholders<br />
that far outweighs any savings on the expense ratio front.<br />
Seventy-four ETFs make the honors list by this measure, posting<br />
average spreads of less than 0.10 percent for the time period<br />
studied. They included three CurrencyShares fixed-in<strong>com</strong>e ETFs<br />
from Rydex, five HOLDRS, nine ProShares ETFs (two leveraged<br />
funds and seven inverse-leveraged funds) and all nine of the<br />
Select Sector SPDR ETFs, among others.<br />
Large funds also did well: all 10 of the top 10 ETFs by total<br />
assets made the list.<br />
BGI had the largest number of ETFs on the list (36), including<br />
a large number of individual country funds.<br />
Larger Funds, Tighter Spreads<br />
One question people ask is whether less-established ETFs<br />
have larger spreads. To analyze this, I broke down available ETFs<br />
by net assets under management. The results are unequivocal.<br />
The very largest ETFs—those with assets of more than $10<br />
billion—all had spreads of 0.05 percent or less. As asset size<br />
falls, the percentage of ETFs meeting this tightest category<br />
Fund Company<br />
# of ETFs<br />
BGI 36<br />
SSgA 17<br />
ProShares 9<br />
HOLDRS 5<br />
Rydex (CurrencyShares) 3<br />
PowerShares 1<br />
Van Eck 1<br />
Vanguard 1<br />
Victoria Bay 1<br />
Source: NYSE Arcavision. Data for January 1, 2008 through March 31, 2008.<br />
falls in lockstep: 56 percent for funds between $1 billion and<br />
$10 billion; 13 percent for funds between $500 million and<br />
$999 million; 4 percent for funds between $100 million and<br />
$499 million; and zero for funds smaller than that.<br />
In fact, as you scroll across the grid in Figure 5, you see<br />
that there is a direct relationship between net assets and<br />
average spread percentage: As assets shrink, spreads widen.<br />
Note, for instance, that zero funds with assets under $100<br />
million had spreads of less than 0.1 percent.<br />
More Trading, Lower Spreads<br />
Likewise, there is a direct correlation between the amount<br />
of trading in the fund and the average spread. Figure 6 <strong>com</strong>pares<br />
the average spread for ETFs with differing levels of<br />
average daily trading volume.<br />
Eighty percent of all funds with greater than $10 billion<br />
in daily trading volume land in the lowest average spread<br />
decile. That shrinks to just 34 percent for funds with between<br />
$1 billion and $9.9 billion in trading; 2 percent for funds<br />
with between $100 million and $999 million; and negligible<br />
amounts for funds with less trading volume.<br />
The reverse is true as well: Funds with lower trading volume<br />
have higher average spreads.<br />
Liquidity Of The Underlying?<br />
The old consensus was that the liquidity of the underlying<br />
stocks determined the tightness of the spreads. But<br />
research shows that it is the liquidity of the ETF, and not the<br />
32<br />
July/August 2008


