

Bigger Isn't Always Better - IndexUniverse.com
Bigger Isn't Always Better - IndexUniverse.com
Bigger Isn't Always Better - IndexUniverse.com

You also want an ePaper? Increase the reach of your titles
YUMPU automatically turns print PDFs into web optimized ePapers that Google loves.
<strong>Bigger</strong> from page 1<br />
cate to a fixed in<strong>com</strong>e fund are credit risk<br />
and duration.<br />
Since we’re talking about short-term<br />
Treasurys, the appetite for credit risk is clear:<br />
zilch. That leaves only duration, or the sensitivity<br />
of a fund to changes in interest rates.<br />
SHV—despite the cute ticker—has a much<br />
higher duration than its smaller peer, the<br />
iShares Barclays Short Treasury Bond ETF<br />
(NYSE Arca: SHV): 1.79 vs. just 0.36. SHV’s<br />
mandate is to invest in Treasurys with less<br />
than 12 months to expiration.<br />
Is SHV right for everyone? Of course<br />
not. Its short-term focus means its 30-<br />
day SEC yield is actually negative (-0.05<br />
percent), <strong>com</strong>pared with the whopping<br />
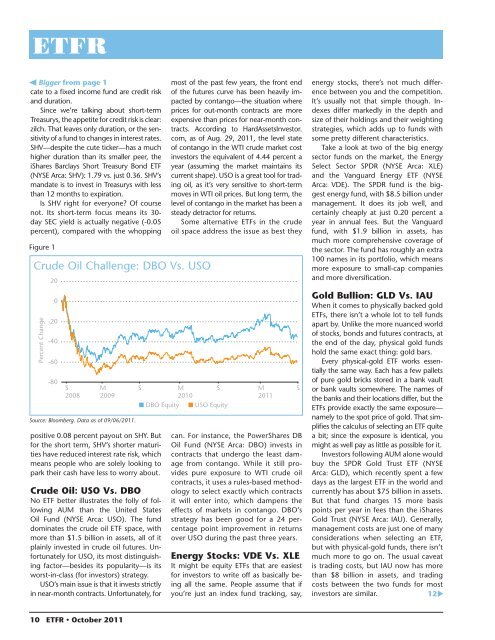
Figure 1<br />
Crude Oil Challenge: DBO Vs. USO<br />
Percent Change<br />
20<br />
0<br />
-20<br />
-40<br />
-60<br />
-80<br />
S<br />
2008<br />
M<br />
2009<br />
Source: Bloomberg. Data as of 09/06/2011.<br />
positive 0.08 percent payout on SHY. But<br />
for the short term, SHV’s shorter maturities<br />
have reduced interest rate risk, which<br />
means people who are solely looking to<br />
park their cash have less to worry about.<br />
Crude Oil: USO Vs. DBO<br />
No ETF better illustrates the folly of following<br />
AUM than the United States<br />
Oil Fund (NYSE Arca: USO). The fund<br />
dominates the crude oil ETF space, with<br />
more than $1.5 billion in assets, all of it<br />
plainly invested in crude oil futures. Unfortunately<br />
for USO, its most distinguishing<br />
factor—besides its popularity—is its<br />
worst-in-class (for investors) strategy.<br />
USO’s main issue is that it invests strictly<br />
in near-month contracts. Unfortunately, for<br />
most of the past few years, the front end<br />
of the futures curve has been heavily impacted<br />
by contango—the situation where<br />
prices for out-month contracts are more<br />
expensive than prices for near-month contracts.<br />
According to HardAssetsInvestor.<br />
<strong>com</strong>, as of Aug. 29, 2011, the level state<br />
of contango in the WTI crude market cost<br />
investors the equivalent of 4.44 percent a<br />
year (assuming the market maintains its<br />
current shape). USO is a great tool for trading<br />
oil, as it’s very sensitive to short-term<br />
moves in WTI oil prices. But long term, the<br />
level of contango in the market has been a<br />
steady detractor for returns.<br />
Some alternative ETFs in the crude<br />
oil space address the issue as best they<br />
S<br />
M<br />
S<br />
2010<br />
■ DBO Equity ■ USO Equity<br />
M<br />
2011<br />
can. For instance, the PowerShares DB<br />
Oil Fund (NYSE Arca: DBO) invests in<br />
contracts that undergo the least damage<br />
from contango. While it still provides<br />
pure exposure to WTI crude oil<br />
contracts, it uses a rules-based methodology<br />
to select exactly which contracts<br />
it will enter into, which dampens the<br />
effects of markets in contango. DBO’s<br />
strategy has been good for a 24 percentage<br />
point improvement in returns<br />
over USO during the past three years.<br />
Energy Stocks: VDE Vs. XLE<br />
It might be equity ETFs that are easiest<br />
for investors to write off as basically being<br />
all the same. People assume that if<br />
you’re just an index fund tracking, say,<br />
S<br />
energy stocks, there’s not much difference<br />
between you and the <strong>com</strong>petition.<br />
It’s usually not that simple though. Indexes<br />
differ markedly in the depth and<br />
size of their holdings and their weighting<br />
strategies, which adds up to funds with<br />
some pretty different characteristics.<br />
Take a look at two of the big energy<br />
sector funds on the market, the Energy<br />
Select Sector SPDR (NYSE Arca: XLE)<br />
and the Vanguard Energy ETF (NYSE<br />
Arca: VDE). The SPDR fund is the biggest<br />
energy fund, with $8.5 billion under<br />
management. It does its job well, and<br />
certainly cheaply at just 0.20 percent a<br />
year in annual fees. But the Vanguard<br />
fund, with $1.9 billion in assets, has<br />
much more <strong>com</strong>prehensive coverage of<br />
the sector. The fund has roughly an extra<br />
100 names in its portfolio, which means<br />
more exposure to small-cap <strong>com</strong>panies<br />
and more diversification.<br />
Gold Bullion: GLD Vs. IAU<br />
When it <strong>com</strong>es to physically backed gold<br />
ETFs, there isn’t a whole lot to tell funds<br />
apart by. Unlike the more nuanced world<br />
of stocks, bonds and futures contracts, at<br />
the end of the day, physical gold funds<br />
hold the same exact thing: gold bars.<br />
Every physical-gold ETF works essentially<br />
the same way. Each has a few pallets<br />
of pure gold bricks stored in a bank vault<br />
or bank vaults somewhere. The names of<br />
the banks and their locations differ, but the<br />
ETFs provide exactly the same exposure—<br />
namely to the spot price of gold. That simplifies<br />
the calculus of selecting an ETF quite<br />
a bit; since the exposure is identical, you<br />
might as well pay as little as possible for it.<br />
Investors following AUM alone would<br />
buy the SPDR Gold Trust ETF (NYSE<br />
Arca: GLD), which recently spent a few<br />
days as the largest ETF in the world and<br />
currently has about $75 billion in assets.<br />
But that fund charges 15 more basis<br />
points per year in fees than the iShares<br />
Gold Trust (NYSE Arca: IAU). Generally,<br />
management costs are just one of many<br />
considerations when selecting an ETF,<br />
but with physical-gold funds, there isn’t<br />
much more to go on. The usual caveat<br />
is trading costs, but IAU now has more<br />
than $8 billion in assets, and trading<br />
costs between the two funds for most<br />
investors are similar.<br />
12<br />
10 ETFR • October 2011


