

Bigger Isn't Always Better - IndexUniverse.com
Bigger Isn't Always Better - IndexUniverse.com
Bigger Isn't Always Better - IndexUniverse.com

You also want an ePaper? Increase the reach of your titles
YUMPU automatically turns print PDFs into web optimized ePapers that Google loves.
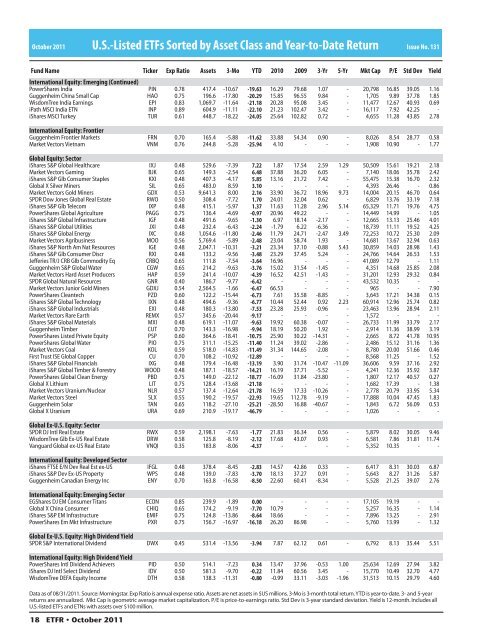
October 2011 U.S.-Listed ETFs Sorted by Asset Class and Year-to-Date Return<br />
Issue No. 131<br />
Fund Name Ticker Exp Ratio Assets 3-Mo YTD 2010 2009 3-Yr 5-Yr Mkt Cap P/E Std Dev<br />
International Equity: Emerging (Continued)<br />
PowerShares India PIN 0.78 417.4 -10.67 -19.63 16.29 79.68 1.07 - 20,798 16.85 39.05 1.16<br />
Guggenheim China Small Cap HAO 0.75 196.6 -17.80 -20.29 15.85 96.55 9.84 - 1,705 9.89 37.78 1.85<br />
WisdomTree India Earnings EPI 0.83 1,069.7 -11.64 -21.18 20.28 95.08 3.45 - 11,477 12.67 40.93 0.69<br />
iPath MSCI India ETN INP 0.89 604.9 -11.11 -22.10 21.23 102.47 3.42 - 16,117 7.92 42.25 -<br />
iShares MSCI Turkey TUR 0.61 448.7 -18.22 -24.05 25.64 102.82 0.72 - 4,655 11.28 43.85 2.78<br />
International Equity: Frontier<br />
Guggenheim Frontier Markets FRN 0.70 165.4 -5.88 -11.62 33.88 54.34 0.90 - 8,026 8.54 28.77 0.58<br />
Market Vectors Vietnam VNM 0.76 244.8 -5.28 -25.94 4.10 - - - 1,908 10.90 - 1.77<br />
Global Equity: Sector<br />
iShares S&P Global Healthcare IXJ 0.48 529.6 -7.39 7.22 1.87 17.54 2.59 1.29 50,509 15.61 19.21 2.18<br />
Market Vectors Gaming BJK 0.65 149.3 -2.54 6.48 37.88 36.20 6.05 - 7,140 18.06 35.78 2.42<br />
iShares S&P Glb Consumer Staples KXI 0.48 407.3 -4.17 5.85 13.16 21.72 7.42 - 55,475 15.38 16.70 2.32<br />
Global X Silver Miners SIL 0.65 483.0 8.59 3.10 - - - - 4,393 26.46 - 0.86<br />
Market Vectors Gold Miners GDX 0.53 9,641.3 8.00 2.16 33.90 36.72 18.96 9.73 14,004 20.15 46.70 0.64<br />
SPDR Dow Jones Global Real Estate RWO 0.50 308.4 -7.72 1.70 24.01 32.04 0.62 - 6,829 13.76 33.19 7.18<br />
iShares S&P Glb Tele<strong>com</strong> IXP 0.48 415.1 -5.97 1.37 11.63 11.28 2.96 5.14 65,329 11.71 19.76 4.75<br />
PowerShares Global Agriculture PAGG 0.75 136.4 -4.69 -0.97 20.96 49.22 - - 14,449 14.99 - 1.05<br />
iShares S&P Global Infrastructure IGF 0.48 491.6 -9.65 -1.30 6.97 18.14 -2.17 - 12,665 13.13 25.46 4.01<br />
iShares S&P Global Utilities JXI 0.48 232.4 -6.43 -2.24 -1.79 6.22 -6.36 - 18,739 11.11 19.52 4.25<br />
iShares S&P Global Energy IXC 0.48 1,054.6 -11.80 -2.46 11.79 24.71 -2.47 3.49 72,253 10.72 25.30 2.09<br />
Market Vectors Agribusiness MOO 0.56 5,769.4 -5.89 -2.48 23.04 58.74 1.93 - 14,681 13.67 32.94 0.63<br />
iShares S&P North Am Nat Resources IGE 0.48 2,047.1 -10.31 -3.21 23.34 37.10 -0.88 5.43 30,859 14.03 28.98 1.43<br />
iShares S&P Glb Consumer Discr RXI 0.48 133.2 -9.56 -3.48 23.29 37.45 5.24 - 24,766 14.64 26.53 1.53<br />
Jefferies TR/J CRB Glb Commodity Eq CRBQ 0.65 111.8 -7.54 -3.64 16.96 - - - 41,089 12.79 - 1.11<br />
Guggenheim S&P Global Water CGW 0.65 214.2 -9.63 -3.76 15.02 31.54 -1.45 - 4,351 14.68 25.85 2.08<br />
Market Vectors Hard Asset Producers HAP 0.59 241.4 -10.07 -4.39 16.52 42.51 -1.43 - 31,201 12.93 29.32 0.84<br />
SPDR Global Natural Resources GNR 0.40 186.7 -9.77 -6.42 - - - - 43,532 10.35 - -<br />
Market Vectors Junior Gold Miners GDXJ 0.54 2,564.5 -1.66 -6.47 66.53 - - - 965 - - 7.90<br />
PowerShares Cleantech PZD 0.60 122.2 -15.44 -6.73 7.61 35.58 -8.85 - 3,643 17.21 34.38 0.15<br />
iShares S&P Global Technology IXN 0.48 494.6 -9.36 -6.77 10.44 52.44 0.92 2.23 60,914 12.96 25.74 0.82<br />
iShares S&P Global Industrials EXI 0.48 180.3 -13.80 -7.53 23.28 25.93 -0.96 - 23,463 13.96 28.94 2.11<br />
Market Vectors Rare Earth REMX 0.57 345.6 -20.44 -9.17 - - - - 1,572 - - -<br />
iShares S&P Global Materials MXI 0.48 619.1 -11.07 -9.63 19.92 60.38 -0.07 - 26,733 11.99 33.79 2.17<br />
Guggenheim Timber CUT 0.70 143.3 -16.98 -9.94 18.19 50.20 1.92 - 2,914 11.36 38.99 3.19<br />
PowerShares Listed Private Equity PSP 0.60 364.6 -18.41 -10.75 25.90 30.22 -14.31 - 2,665 8.72 41.78 10.95<br />
PowerShares Global Water PIO 0.75 311.1 -15.25 -11.40 11.24 39.02 -2.86 - 2,486 15.12 31.16 1.36<br />
Market Vectors Coal KOL 0.59 518.0 -14.83 -11.49 31.34 144.65 -2.08 - 8,780 20.00 51.66 0.46<br />
First Trust ISE Global Copper CU 0.70 108.2 -10.92 -12.89 - - - - 8,568 11.25 - 1.52<br />
iShares S&P Global Financials IXG 0.48 179.4 -16.48 -13.19 3.90 31.74 -10.47 -11.09 36,606 9.59 37.16 2.92<br />
iShares S&P Global Timber & Forestry WOOD 0.48 187.1 -18.57 -14.21 16.19 37.71 -5.52 - 4,241 12.36 35.92 3.87<br />
PowerShares Global Clean Energy PBD 0.75 149.0 -22.12 -18.77 -16.09 31.84 -23.80 - 1,807 12.17 40.57 0.27<br />
Global X Lithium LIT 0.75 128.4 -13.68 -21.18 - - - - 1,682 17.39 - 1.38<br />
Market Vectors Uranium/Nuclear NLR 0.57 137.4 -12.64 -21.78 16.59 17.33 -10.26 - 2,778 20.79 33.95 5.34<br />
Market Vectors Steel SLX 0.55 190.2 -19.57 -22.93 19.65 112.78 -9.19 - 17,888 10.04 47.45 1.83<br />
Guggenheim Solar TAN 0.65 118.2 -27.10 -25.21 -28.50 16.88 -40.67 - 1,843 6.72 56.09 0.53<br />
Global X Uranium URA 0.69 210.9 -19.17 -46.79 - - - - 1,026 - - -<br />
Global Ex-U.S. Equity: Sector<br />
SPDR DJ Intl Real Estate RWX 0.59 2,198.1 -7.63 -1.77 21.83 36.34 0.56 - 5,879 8.02 30.05 9.46<br />
WisdomTree Glb Ex-US Real Estate DRW 0.58 125.8 -8.19 -2.12 17.68 43.07 0.93 - 6,581 7.86 31.81 11.74<br />
Vanguard Global ex-US Real Estate VNQI 0.35 183.8 -8.06 -4.37 - - - - 5,352 10.35 - -<br />
International Equity: Developed Sector<br />
iShares FTSE E/N Dev Real Est ex-US IFGL 0.48 378.4 -8.45 -2.83 14.57 42.86 0.33 - 6,417 8.31 30.03 6.87<br />
iShares S&P Dev Ex-US Property WPS 0.48 139.0 -7.83 -3.70 18.13 37.27 0.91 - 5,643 8.27 31.26 5.87<br />
Guggenheim Canadian Energy Inc ENY 0.70 163.8 -16.58 -8.50 22.60 60.41 -8.34 - 5,528 21.25 39.07 2.76<br />
International Equity: Emerging Sector<br />
EGShares DJ EM Consumer Titans ECON 0.85 239.9 -1.89 0.00 - - - - 17,105 19.19 - -<br />
Global X China Consumer CHIQ 0.65 174.2 -9.19 -7.70 10.79 - - - 5,257 16.35 - 1.14<br />
iShares S&P EM Infrastructure EMIF 0.75 124.8 -13.86 -8.64 18.66 - - - 7,896 13.25 - 2.91<br />
PowerShares Em Mkt Infrastructure PXR 0.75 156.7 -16.97 -16.18 26.20 86.98 - - 5,760 13.99 - 1.32<br />
Global Ex-U.S. Equity: High Dividend Yield<br />
SPDR S&P International Dividend DWX 0.45 531.4 -13.56 -3.94 7.87 62.12 0.61 - 6,792 8.13 35.44 5.51<br />
International Equity: High Dividend Yield<br />
PowerShares Intl Dividend Achievers PID 0.50 514.1 -7.23 0.34 13.47 37.96 -0.53 1.00 25,634 12.69 27.94 3.82<br />
iShares DJ Intl Select Dividend IDV 0.50 581.3 -9.70 -0.22 11.84 60.56 3.45 - 15,770 10.49 32.70 4.77<br />
WisdomTree DEFA Equity In<strong>com</strong>e DTH 0.58 138.3 -11.31 -0.80 -0.99 33.11 -3.03 -1.96 31,513 10.15 29.79 4.60<br />
Data as of 08/31/2011. Source: Morningstar. Exp Ratio is annual expense ratio. Assets are net assets in $US millions. 3-Mo is 3-month total return. YTD is year-to-date. 3- and 5-year<br />
returns are annualized. Mkt Cap is geometric average market capitalization. P/E is price-to-earnings ratio. Std Dev is 3-year standard deviation. Yield is 12-month. Includes all<br />
U.S.-listed ETFs and ETNs with assets over $100 million.<br />
18 ETFR • October 2011<br />
Yield


