

Bigger Isn't Always Better - IndexUniverse.com
Bigger Isn't Always Better - IndexUniverse.com
Bigger Isn't Always Better - IndexUniverse.com

Create successful ePaper yourself
Turn your PDF publications into a flip-book with our unique Google optimized e-Paper software.
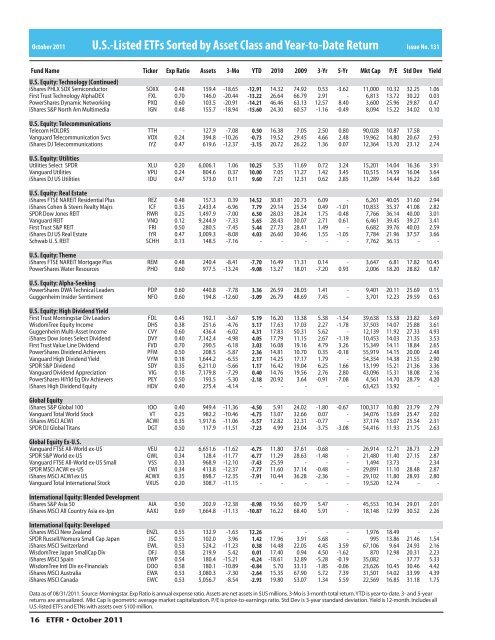
October 2011 U.S.-Listed ETFs Sorted by Asset Class and Year-to-Date Return<br />
Issue No. 131<br />
Fund Name Ticker Exp Ratio Assets 3-Mo YTD 2010 2009 3-Yr 5-Yr Mkt Cap P/E Std Dev<br />
U.S. Equity: Technology (Continued)<br />
iShares PHLX SOX Semiconductor SOXX 0.48 159.4 -18.65 -12.91 14.32 74.92 0.53 -3.62 11,000 10.32 32.25 1.06<br />
First Trust Technology AlphaDEX FXL 0.70 146.0 -20.44 -13.22 26.64 66.79 2.91 - 6,813 13.72 30.22 0.03<br />
PowerShares Dynamic Networking PXQ 0.60 103.5 -20.91 -14.21 46.46 63.13 12.57 8.40 3,600 25.96 29.87 0.47<br />
iShares S&P North Am Multimedia IGN 0.48 155.7 -18.94 -15.60 24.30 60.57 -1.16 -0.49 8,094 15.22 34.02 0.10<br />
U.S. Equity: Tele<strong>com</strong>munications<br />
Tele<strong>com</strong> HOLDRS TTH - 127.9 -7.08 0.50 16.38 7.05 2.50 0.80 90,028 10.87 17.58 -<br />
Vanguard Tele<strong>com</strong>munication Svcs VOX 0.24 394.8 -10.26 -0.73 19.52 29.45 4.66 2.48 19,962 14.80 20.67 2.93<br />
iShares DJ Tele<strong>com</strong>munications IYZ 0.47 619.6 -12.37 -3.15 20.72 26.22 1.36 0.07 12,364 13.70 23.12 2.74<br />
U.S. Equity: Utilities<br />
Utilities Select SPDR XLU 0.20 6,006.1 1.06 10.25 5.35 11.69 0.72 3.24 15,201 14.04 16.36 3.91<br />
Vanguard Utilities VPU 0.24 804.6 0.37 10.00 7.05 11.27 1.42 3.45 10,515 14.59 16.04 3.64<br />
iShares DJ US Utilities IDU 0.47 573.0 0.11 9.60 7.21 12.31 0.62 2.85 11,289 14.44 16.22 3.60<br />
U.S. Equity: Real Estate<br />
iShares FTSE NAREIT Residential Plus REZ 0.48 157.3 0.39 14.52 30.81 20.73 6.09 - 6,261 40.05 31.60 2.94<br />
iShares Cohen & Steers Realty Majrs ICF 0.35 2,433.4 -6.96 7.79 29.14 25.54 0.49 -1.01 10,833 35.37 41.08 2.82<br />
SPDR Dow Jones REIT RWR 0.25 1,497.9 -7.00 6.50 28.03 28.24 1.75 -0.48 7,766 36.14 40.00 3.01<br />
Vanguard REIT VNQ 0.12 9,244.9 -7.33 5.65 28.43 30.07 2.71 0.61 6,461 39.45 39.27 3.41<br />
First Trust S&P REIT FRI 0.50 280.5 -7.45 5.44 27.73 28.41 1.49 - 6,682 39.76 40.03 2.59<br />
iShares DJ US Real Estate IYR 0.47 3,009.3 -8.08 4.03 26.60 30.46 1.55 -1.05 7,784 21.96 37.57 3.66<br />
Schwab U. S. REIT SCHH 0.13 148.5 -7.16 - - - - - 7,762 36.13 - -<br />
U.S. Equity: Theme<br />
iShares FTSE NAREIT Mortgage Plus REM 0.48 240.4 -8.41 -7.70 16.49 11.31 0.14 - 3,647 6.81 17.82 10.45<br />
PowerShares Water Resources PHO 0.60 977.5 -13.24 -9.08 13.27 18.01 -7.20 0.93 2,006 18.20 28.82 0.87<br />
U.S. Equity: Alpha-Seeking<br />
PowerShares DWA Technical Leaders PDP 0.60 440.8 -7.78 3.36 26.59 28.03 1.41 - 9,401 20.11 25.69 0.15<br />
Guggenheim Insider Sentiment NFO 0.60 194.8 -12.60 -3.09 26.79 48.69 7.45 - 3,701 12.23 29.59 0.63<br />
U.S. Equity: High Dividend Yield<br />
First Trust Morningstar Div Leaders FDL 0.45 192.1 -3.67 5.19 16.20 13.38 5.38 -1.54 39,638 13.58 23.82 3.69<br />
WisdomTree Equity In<strong>com</strong>e DHS 0.38 251.6 -4.76 5.17 17.63 17.03 2.27 -1.78 37,503 14.07 25.88 3.61<br />
Guggenheim Multi-Asset In<strong>com</strong>e CVY 0.60 436.4 -6.02 4.31 17.83 50.31 5.62 - 12,139 11.92 27.33 4.93<br />
iShares Dow Jones Select Dividend DVY 0.40 7,142.4 -4.98 4.05 17.79 11.15 2.67 -1.19 10,453 14.03 21.35 3.53<br />
First Trust Value Line Dividend FVD 0.70 290.5 -6.18 3.03 16.08 19.16 4.79 3.26 15,349 14.11 18.84 2.65<br />
PowerShares Dividend Achievers PFM 0.50 208.5 -5.87 2.36 14.81 10.70 0.35 -0.18 55,919 14.15 20.00 2.48<br />
Vanguard High Dividend Yield VYM 0.18 1,644.2 -6.55 2.17 14.25 17.17 1.79 - 54,354 14.38 21.55 2.90<br />
SPDR S&P Dividend SDY 0.35 6,211.0 -5.66 1.17 16.42 19.04 6.25 1.66 13,199 15.21 21.36 3.36<br />
Vanguard Dividend Appreciation VIG 0.18 7,179.8 -7.29 0.40 14.76 19.56 2.76 2.80 43,096 15.31 18.08 2.16<br />
PowerShares HiYld Eq Div Achievers PEY 0.50 193.5 -5.30 -2.18 20.92 3.64 -0.91 -7.08 4,561 14.70 28.79 4.20<br />
iShares High Dividend Equity HDV 0.40 275.4 -4.14 - - - - - 63,423 13.92 - -<br />
Global Equity<br />
iShares S&P Global 100 IOO 0.40 949.4 -11.36 -4.50 5.91 24.02 -1.80 -0.67 100,317 10.80 23.79 2.79<br />
Vanguard Total World Stock VT 0.25 982.2 -10.46 -4.75 13.07 32.66 0.07 - 34,076 13.69 25.47 2.02<br />
iShares MSCI ACWI ACWI 0.35 1,917.6 -11.06 -5.57 12.82 32.31 -0.77 - 37,174 13.07 25.54 2.31<br />
SPDR DJ Global Titans DGT 0.50 117.9 -11.51 -7.23 4.99 23.04 -3.75 -3.08 54,416 11.93 21.75 2.63<br />
Global Equity Ex-U.S.<br />
Vanguard FTSE All-World ex-US VEU 0.22 6,651.6 -11.62 -6.75 11.80 37.61 -0.68 - 26,914 12.71 28.73 2.29<br />
SPDR S&P World ex-US GWL 0.34 128.4 -11.77 -6.77 11.29 28.63 -1.48 - 21,480 11.40 27.15 2.87<br />
Vanguard FTSE All-World ex-US Small VSS 0.33 968.9 -12.10 -7.43 25.59 - - - 1,494 13.73 - 2.34<br />
SPDR MSCI ACWI ex-US CWI 0.34 413.8 -12.37 -7.77 11.60 37.14 -0.48 - 29,891 11.10 28.48 2.87<br />
iShares MSCI ACWI ex US ACWX 0.35 898.7 -12.35 -7.91 10.44 36.28 -2.36 - 29,102 11.80 28.93 2.80<br />
Vanguard Total International Stock VXUS 0.20 308.7 -11.15 - - - - - 19,520 12.74 - -<br />
International Equity: Blended Development<br />
iShares S&P Asia 50 AIA 0.50 202.9 -12.38 -8.98 19.56 60.79 5.47 - 45,553 10.34 29.01 2.01<br />
iShares MSCI All Country Asia ex-Jpn AAXJ 0.69 1,664.8 -11.13 -10.87 16.22 68.40 5.91 - 18,148 12.99 30.52 2.26<br />
International Equity: Developed<br />
iShares MSCI New Zealand ENZL 0.55 132.9 -1.63 12.26 - - - - 1,976 18.49 - -<br />
SPDR Russell/Nomura Small Cap Japan JSC 0.55 102.0 3.96 1.42 17.96 3.91 5.68 - 995 13.86 21.46 1.54<br />
iShares MSCI Switzerland EWL 0.53 524.2 -11.23 0.38 14.48 22.05 4.45 3.59 67,106 9.64 24.93 2.16<br />
WisdomTree Japan SmallCap Div DFJ 0.58 219.9 5.42 0.01 17.40 0.94 4.50 -1.62 870 12.98 20.31 2.23<br />
iShares MSCI Spain EWP 0.54 180.4 -15.21 -0.24 -18.61 32.89 -5.28 -0.19 35,082 - 37.77 5.33<br />
WisdomTree Intl Div ex-Financials DOO 0.58 180.1 -10.89 -0.84 5.70 33.13 -1.85 -0.06 23,626 10.45 30.46 4.42<br />
iShares MSCI Australia EWA 0.53 3,080.3 -7.30 -2.64 15.35 67.90 5.72 7.39 31,501 14.02 33.99 4.39<br />
iShares MSCI Canada EWC 0.53 5,056.7 -8.54 -2.93 19.80 53.07 1.34 5.59 22,569 16.85 31.18 1.75<br />
Data as of 08/31/2011. Source: Morningstar. Exp Ratio is annual expense ratio. Assets are net assets in $US millions. 3-Mo is 3-month total return. YTD is year-to-date. 3- and 5-year<br />
returns are annualized. Mkt Cap is geometric average market capitalization. P/E is price-to-earnings ratio. Std Dev is 3-year standard deviation. Yield is 12-month. Includes all<br />
U.S.-listed ETFs and ETNs with assets over $100 million.<br />
16 ETFR • October 2011<br />
Yield


