

Bigger Isn't Always Better - IndexUniverse.com
Bigger Isn't Always Better - IndexUniverse.com
Bigger Isn't Always Better - IndexUniverse.com

Create successful ePaper yourself
Turn your PDF publications into a flip-book with our unique Google optimized e-Paper software.
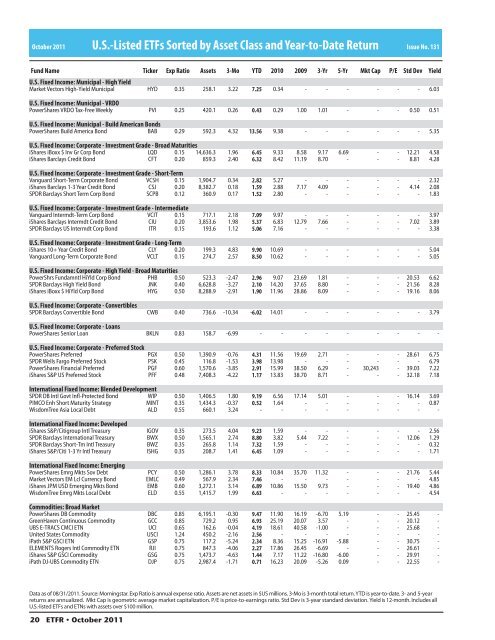
October 2011 U.S.-Listed ETFs Sorted by Asset Class and Year-to-Date Return<br />
Issue No. 131<br />
Fund Name Ticker Exp Ratio Assets 3-Mo YTD 2010 2009 3-Yr 5-Yr Mkt Cap P/E Std Dev<br />
U.S. Fixed In<strong>com</strong>e: Municipal - High Yield<br />
Market Vectors High-Yield Municipal HYD 0.35 258.1 3.22 7.25 0.34 - - - - - - 6.03<br />
U.S. Fixed In<strong>com</strong>e: Municipal - VRDO<br />
PowerShares VRDO Tax-Free Weekly PVI 0.25 420.1 0.26 0.43 0.29 1.00 1.01 - - - 0.50 0.51<br />
U.S. Fixed In<strong>com</strong>e: Municipal - Build American Bonds<br />
PowerShares Build America Bond BAB 0.29 592.3 4.32 13.56 9.38 - - - - - - 5.35<br />
U.S. Fixed In<strong>com</strong>e: Corporate - Investment Grade - Broad Maturities<br />
iShares iBoxx $ Inv Gr Corp Bond LQD 0.15 14,636.3 1.96 6.45 9.33 8.58 9.17 6.69 - - 12.21 4.58<br />
iShares Barclays Credit Bond CFT 0.20 859.3 2.40 6.32 8.42 11.19 8.70 - - - 8.81 4.28<br />
U.S. Fixed In<strong>com</strong>e: Corporate - Investment Grade - Short-Term<br />
Vanguard Short-Term Corporate Bond VCSH 0.15 1,904.7 0.34 2.82 5.27 - - - - - - 2.32<br />
iShares Barclays 1-3 Year Credit Bond CSJ 0.20 8,382.7 0.18 1.59 2.88 7.17 4.09 - - - 4.14 2.08<br />
SPDR Barclays Short Term Corp Bond SCPB 0.12 360.9 0.17 1.52 2.80 - - - - - - 1.83<br />
U.S. Fixed In<strong>com</strong>e: Corporate - Investment Grade - Intermediate<br />
Vanguard Intermdt-Term Corp Bond VCIT 0.15 717.1 2.18 7.09 9.97 - - - - - - 3.97<br />
iShares Barclays Intermdt Credit Bond CIU 0.20 3,853.6 1.98 5.37 6.83 12.79 7.66 - - - 7.02 3.89<br />
SPDR Barclays US Intermdt Corp Bond ITR 0.15 193.6 1.12 5.06 7.16 - - - - - - 3.38<br />
U.S. Fixed In<strong>com</strong>e: Corporate - Investment Grade - Long-Term<br />
iShares 10+ Year Credit Bond CLY 0.20 199.3 4.83 9.90 10.69 - - - - - - 5.04<br />
Vanguard Long-Term Corporate Bond VCLT 0.15 274.7 2.57 8.50 10.62 - - - - - - 5.05<br />
U.S. Fixed In<strong>com</strong>e: Corporate - High Yield - Broad Maturities<br />
PowerShrs Fundamntl HiYld Corp Bond PHB 0.50 523.3 -2.47 2.96 9.07 23.69 1.81 - - - 20.53 6.62<br />
SPDR Barclays High Yield Bond JNK 0.40 6,628.8 -3.27 2.10 14.20 37.65 8.80 - - - 21.56 8.28<br />
iShares iBoxx $ HiYld Corp Bond HYG 0.50 8,288.9 -2.91 1.90 11.96 28.86 8.09 - - - 19.16 8.06<br />
U.S. Fixed In<strong>com</strong>e: Corporate - Convertibles<br />
SPDR Barclays Convertible Bond CWB 0.40 736.6 -10.34 -6.02 14.01 - - - - - - 3.79<br />
U.S. Fixed In<strong>com</strong>e: Corporate - Loans<br />
PowerShares Senior Loan BKLN 0.83 158.7 -6.99 - - - - - - - - -<br />
U.S. Fixed In<strong>com</strong>e: Corporate - Preferred Stock<br />
PowerShares Preferred PGX 0.50 1,390.9 -0.76 4.31 11.56 19.69 2.71 - - - 28.61 6.75<br />
SPDR Wells Fargo Preferred Stock PSK 0.45 116.8 -1.53 3.98 13.98 - - - - - - 6.79<br />
PowerShares Financial Preferred PGF 0.60 1,570.6 -3.85 2.91 15.99 38.50 6.29 - 30,243 - 39.03 7.22<br />
iShares S&P US Preferred Stock PFF 0.48 7,408.3 -4.22 1.17 13.83 38.70 8.71 - - - 32.18 7.18<br />
International Fixed In<strong>com</strong>e: Blended Development<br />
SPDR DB Intl Govt In-Protected Bond WIP 0.50 1,406.5 1.80 9.19 6.56 17.14 5.01 - - - 16.14 3.69<br />
PIMCO Enh Short Maturity Strategy MINT 0.35 1,434.3 -0.37 0.52 1.64 - - - - - - 0.87<br />
WisdomTree Asia Local Debt ALD 0.55 660.1 3.24 - - - - - - - - -<br />
International Fixed In<strong>com</strong>e: Developed<br />
iShares S&P/Citigroup Intl Treasury IGOV 0.35 273.5 4.04 9.23 1.59 - - - - - - 2.56<br />
SPDR Barclays International Treasury BWX 0.50 1,565.1 2.74 8.80 3.82 5.44 7.22 - - - 12.06 1.29<br />
SPDR Barclays Short-Tm Intl Treasury BWZ 0.35 265.8 1.14 7.32 1.59 - - - - - - 0.32<br />
iShares S&P/Citi 1-3 Yr Intl Treasury ISHG 0.35 208.7 1.41 6.45 1.09 - - - - - - 1.71<br />
International Fixed In<strong>com</strong>e: Emerging<br />
PowerShares Emrg Mkts Sov Debt PCY 0.50 1,286.1 3.78 8.33 10.84 35.70 11.32 - - - 21.76 5.44<br />
Market Vectors EM Lcl Currency Bond EMLC 0.49 567.9 2.34 7.46 - - - - - - - 4.85<br />
iShares JPM USD Emerging Mkts Bond EMB 0.60 3,272.1 3.14 6.89 10.86 15.50 9.73 - - - 19.40 4.86<br />
WisdomTree Emrg Mkts Local Debt ELD 0.55 1,415.7 1.99 6.63 - - - - - - - 4.54<br />
Commodities: Broad Market<br />
PowerShares DB Commodity DBC 0.85 6,195.1 -0.30 9.47 11.90 16.19 -6.70 5.19 - - 25.45 -<br />
GreenHaven Continuous Commodity GCC 0.85 729.2 0.95 6.93 25.19 20.07 3.57 - - - 20.12 -<br />
UBS E-TRACS CMCI ETN UCI 0.65 162.6 -0.04 4.19 18.61 40.58 -1.00 - - - 25.68 -<br />
United States Commodity USCI 1.24 450.2 -2.16 2.56 - - - - - - - -<br />
iPath S&P GSCI ETN GSP 0.75 117.2 -5.24 2.34 8.36 15.25 -16.91 -5.88 - - 30.75 -<br />
ELEMENTS Rogers Intl Commodity ETN RJI 0.75 847.3 -4.06 2.27 17.86 26.45 -6.69 - - - 26.61 -<br />
iShares S&P GSCI Commodity GSG 0.75 1,473.7 -4.63 1.44 7.17 11.22 -16.80 -6.00 - - 29.91 -<br />
iPath DJ-UBS Commodity ETN DJP 0.75 2,987.4 -1.71 0.71 16.23 20.09 -5.26 0.09 - - 22.55 -<br />
Yield<br />
Data as of 08/31/2011. Source: Morningstar. Exp Ratio is annual expense ratio. Assets are net assets in $US millions. 3-Mo is 3-month total return. YTD is year-to-date. 3- and 5-year<br />
returns are annualized. Mkt Cap is geometric average market capitalization. P/E is price-to-earnings ratio. Std Dev is 3-year standard deviation. Yield is 12-month. Includes all<br />
U.S.-listed ETFs and ETNs with assets over $100 million.<br />
20 ETFR • October 2011


