

Bigger Isn't Always Better - IndexUniverse.com
Bigger Isn't Always Better - IndexUniverse.com
Bigger Isn't Always Better - IndexUniverse.com

You also want an ePaper? Increase the reach of your titles
YUMPU automatically turns print PDFs into web optimized ePapers that Google loves.
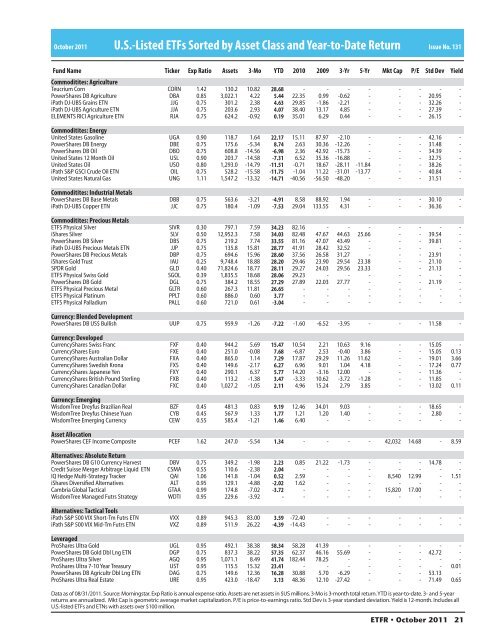
October 2011 U.S.-Listed ETFs Sorted by Asset Class and Year-to-Date Return<br />
Issue No. 131<br />
Fund Name Ticker Exp Ratio Assets 3-Mo YTD 2010 2009 3-Yr 5-Yr Mkt Cap P/E Std Dev<br />
Commoditites: Agriculture<br />
Teucrium Corn CORN 1.42 130.2 10.82 28.68 - - - - - - - -<br />
PowerShares DB Agriculture DBA 0.85 3,022.1 4.22 5.44 22.35 0.99 -0.62 - - - 20.95 -<br />
iPath DJ-UBS Grains ETN JJG 0.75 301.2 2.38 4.63 29.85 -1.86 -2.21 - - - 32.26 -<br />
iPath DJ-UBS Agriculture ETN JJA 0.75 203.6 2.93 4.07 38.40 13.17 4.85 - - - 27.39 -<br />
ELEMENTS RICI Agriculture ETN RJA 0.75 624.2 -0.92 0.19 35.01 6.29 0.44 - - - 26.15 -<br />
Commoditites: Energy<br />
United States Gasoline UGA 0.90 118.7 1.64 22.17 15.11 87.97 -2.10 - - - 42.16 -<br />
PowerShares DB Energy DBE 0.75 175.6 -5.34 8.74 2.63 30.36 -12.26 - - - 31.48 -<br />
PowerShares DB Oil DBO 0.75 608.8 -14.56 -6.98 2.36 42.92 -15.73 - - - 34.39 -<br />
United States 12 Month Oil USL 0.90 203.7 -14.58 -7.31 6.52 35.36 -16.88 - - - 32.75 -<br />
United States Oil USO 0.80 1,293.0 -14.79 -11.51 -0.71 18.67 -28.11 -11.84 - - 38.26 -<br />
iPath S&P GSCI Crude Oil ETN OIL 0.75 528.2 -15.58 -11.75 -1.04 11.22 -31.01 -13.77 - - 40.84 -<br />
United States Natural Gas UNG 1.11 1,547.2 -13.32 -14.71 -40.56 -56.50 -48.20 - - - 31.51 -<br />
Commoditites: Industrial Metals<br />
PowerShares DB Base Metals DBB 0.75 563.6 -3.21 -4.91 8.58 88.92 1.94 - - - 30.10 -<br />
iPath DJ-UBS Copper ETN JJC 0.75 180.4 -1.09 -7.53 29.04 133.55 4.31 - - - 36.36 -<br />
Commoditites: Precious Metals<br />
ETFS Physical Silver SIVR 0.30 797.1 7.59 34.23 82.16 - - - - - - -<br />
iShares Silver SLV 0.50 12,952.3 7.58 34.03 82.48 47.67 44.63 25.66 - - 39.54 -<br />
PowerShares DB Silver DBS 0.75 219.2 7.74 33.55 81.16 47.07 43.49 - - - 39.81 -<br />
iPath DJ-UBS Precious Metals ETN JJP 0.75 135.8 15.81 28.77 41.91 28.42 32.52 - - - - -<br />
PowerShares DB Precious Metals DBP 0.75 694.6 15.96 28.60 37.56 26.58 31.27 - - - 23.91 -<br />
iShares Gold Trust IAU 0.25 9,748.4 18.88 28.20 29.46 23.90 29.54 23.38 - - 21.10 -<br />
SPDR Gold GLD 0.40 71,824.6 18.77 28.11 29.27 24.03 29.56 23.33 - - 21.13 -<br />
ETFS Physical Swiss Gold SGOL 0.39 1,835.5 18.68 28.06 29.23 - - - - - - -<br />
PowerShares DB Gold DGL 0.75 384.2 18.55 27.29 27.89 22.03 27.77 - - - 21.19 -<br />
ETFS Physical Precious Metal GLTR 0.60 267.3 11.81 26.65 - - - - - - - -<br />
ETFS Physical Platinum PPLT 0.60 886.0 0.60 3.77 - - - - - - - -<br />
ETFS Physical Palladium PALL 0.60 721.0 0.61 -3.04 - - - - - - - -<br />
Currency: Blended Development<br />
PowerShares DB US$ Bullish UUP 0.75 959.9 -1.26 -7.22 -1.60 -6.52 -3.95 - - - 11.58 -<br />
Currency: Developed<br />
CurrencyShares Swiss Franc FXF 0.40 944.2 5.69 15.47 10.54 2.21 10.63 9.16 - - 15.05 -<br />
CurrencyShares Euro FXE 0.40 251.0 -0.08 7.68 -6.87 2.53 -0.40 3.86 - - 15.05 0.13<br />
CurrencyShares Australian Dollar FXA 0.40 865.0 1.14 7.29 17.87 29.29 11.26 11.62 - - 19.01 3.66<br />
CurrencyShares Swedish Krona FXS 0.40 149.6 -2.17 6.27 6.96 9.01 1.04 4.18 - - 17.24 0.77<br />
CurrencyShares Japanese Yen FXY 0.40 290.1 6.37 5.77 14.20 -3.16 12.00 - - - 11.36 -<br />
CurrencyShares British Pound Sterling FXB 0.40 113.2 -1.38 3.47 -3.33 10.62 -3.72 -1.28 - - 11.85 -<br />
CurrencyShares Canadian Dollar FXC 0.40 1,027.2 -1.05 2.11 4.96 15.24 2.79 3.85 - - 13.02 0.11<br />
Currency: Emerging<br />
WisdomTree Dreyfus Brazilian Real BZF 0.45 481.3 0.83 9.19 12.46 34.01 9.03 - - - 18.65 -<br />
WisdomTree Dreyfus Chinese Yuan CYB 0.45 567.9 1.33 1.77 1.21 1.20 1.40 - - - 2.80 -<br />
WisdomTree Emerging Currency CEW 0.55 585.4 -1.21 1.46 6.40 - - - - - - -<br />
Asset Allocation<br />
PowerShares CEF In<strong>com</strong>e Composite PCEF 1.62 247.0 -5.54 1.34 - - - - 42,032 14.68 - 8.59<br />
Alternatives: Absolute Return<br />
PowerShares DB G10 Currency Harvest DBV 0.75 349.2 -1.98 2.23 0.85 21.22 -1.73 - - - 14.78 -<br />
Credit Suisse Merger Arbitrage Liquid ETN CSMA 0.55 110.6 -2.38 2.04 - - - - - - - -<br />
IQ Hedge Multi-Strategy Tracker QAI 1.06 141.8 -1.04 0.52 2.59 - - - 8,540 12.99 - 1.51<br />
iShares Diversied Alternatives ALT 0.95 129.1 -4.88 -2.02 1.62 - - - - - - -<br />
Cambria Global Tactical GTAA 0.99 174.8 -7.02 -3.72 - - - - 15,820 17.00 - -<br />
WisdomTree Managed Futrs Strategy WDTI 0.95 229.6 -3.92 - - - - - - - - -<br />
Alternatives: Tactical Tools<br />
iPath S&P 500 VIX Short-Tm Futrs ETN VXX 0.89 945.3 83.00 3.59 -72.40 - - - - - - -<br />
iPath S&P 500 VIX Mid-Tm Futrs ETN VXZ 0.89 511.9 26.22 -4.39 -14.43 - - - - - - -<br />
Leveraged<br />
ProShares Ultra Gold UGL 0.95 492.1 38.38 58.34 58.28 41.39 - - - - - -<br />
PowerShares DB Gold Dbl Lng ETN DGP 0.75 837.3 38.22 57.35 62.37 46.16 55.69 - - - 42.72 -<br />
ProShares Ultra Silver AGQ 0.95 1,071.1 8.49 41.74 182.44 78.25 - - - - - -<br />
ProShares Ultra 7-10 Year Treasury UST 0.95 115.5 15.32 23.41 - - - - - - - 0.01<br />
PowerShares DB Agricultr Dbl Lng ETN DAG 0.75 149.6 12.36 16.28 30.88 5.70 -6.29 - - - 53.13 -<br />
ProShares Ultra Real Estate URE 0.95 423.0 -18.47 3.13 48.36 12.10 -27.42 - - - 71.49 0.65<br />
Data as of 08/31/2011. Source: Morningstar. Exp Ratio is annual expense ratio. Assets are net assets in $US millions. 3-Mo is 3-month total return. YTD is year-to-date. 3- and 5-year<br />
returns are annualized. Mkt Cap is geometric average market capitalization. P/E is price-to-earnings ratio. Std Dev is 3-year standard deviation. Yield is 12-month. Includes all<br />
U.S.-listed ETFs and ETNs with assets over $100 million.<br />
Yield<br />
ETFR • October 2011 21


