DDS RUT500 Router
DDS RUT500 Router
DDS RUT500 Router

Create successful ePaper yourself
Turn your PDF publications into a flip-book with our unique Google optimized e-Paper software.
This tri-graph illustrates average system load over the course of ~3 minutes; each new measurement is taken every 3<br />
seconds. The graph consists out of three colour coded graphs, each one corresponding to the average system load over<br />
1 (red), 5 (orange) and 15 (yellow) most recent minutes. Although not graphed, the page also displays peak loads over 1,<br />
5 and 15 minutes.<br />
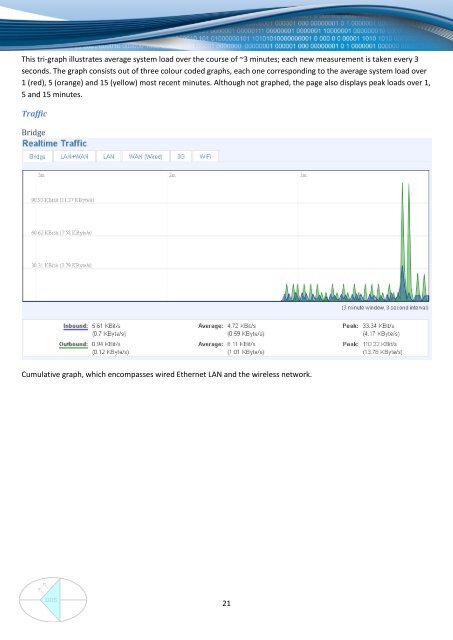
Traffic<br />
Bridge<br />
Cumulative graph, which encompasses wired Ethernet LAN and the wireless network.<br />
21<br />
www.ddszevenbergen.nl