As and Epitaxial-Growth MnSi Thin Films - OPUS Würzburg
As and Epitaxial-Growth MnSi Thin Films - OPUS Würzburg
As and Epitaxial-Growth MnSi Thin Films - OPUS Würzburg

Create successful ePaper yourself
Turn your PDF publications into a flip-book with our unique Google optimized e-Paper software.
40 3. Electric Control of Magnetization in <strong>Thin</strong> (Ga,Mn)<strong>As</strong> Layers<br />
_<br />
[010]<br />
2.0<br />
_<br />
[110] [100] [110] [010]<br />
__<br />
1.8<br />
R/R(Vg = -0.5V)<br />
1.6<br />
1.4<br />
1.2<br />
1.0<br />
0 45 90 135 180<br />
Angle of Magnetization<br />
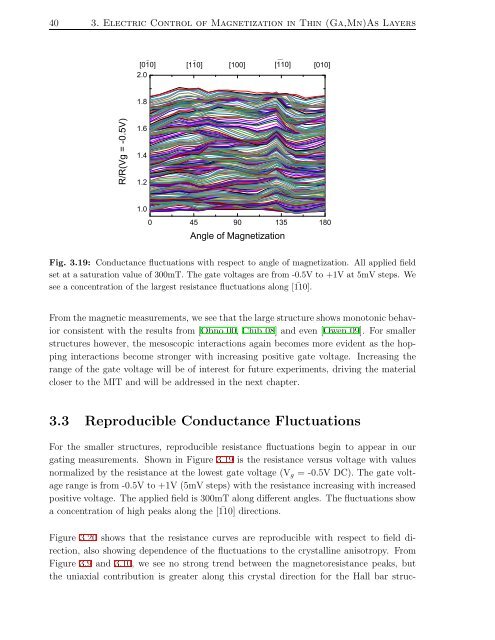
Fig. 3.19: Conductance fluctuations with respect to angle of magnetization. All applied field<br />
set at a saturation value of 300mT. The gate voltages are from -0.5V to +1V at 5mV steps. We<br />
see a concentration of the largest resistance fluctuations along [ 110]. ¯<br />
Fromthemagneticmeasurements, wesee thatthelargestructureshows monotonicbehavior<br />
consistent with the results from [Ohno 00, Chib 08] <strong>and</strong> even [Owen 09]. For smaller<br />
structures however, the mesoscopic interactions again becomes more evident as the hopping<br />
interactions become stronger with increasing positive gate voltage. Increasing the<br />
range of the gate voltage will be of interest for future experiments, driving the material<br />
closer to the MIT <strong>and</strong> will be addressed in the next chapter.<br />
3.3 Reproducible Conductance Fluctuations<br />
For the smaller structures, reproducible resistance fluctuations begin to appear in our<br />
gating measurements. Shown in Figure 3.19 is the resistance versus voltage with values<br />
normalized by the resistance at the lowest gate voltage (V g = -0.5V DC). The gate voltage<br />
range is from -0.5V to +1V (5mV steps) with the resistance increasing with increased<br />
positive voltage. The applied field is 300mT along different angles. The fluctuations show<br />
a concentration of high peaks along the [ 110] ¯ directions.<br />
Figure 3.20 shows that the resistance curves are reproducible with respect to field direction,<br />
also showing dependence of the fluctuations to the crystalline anisotropy. From<br />
Figure 3.9 <strong>and</strong> 3.10, we see no strong trend between the magnetoresistance peaks, but<br />
the uniaxial contribution is greater along this crystal direction for the Hall bar struc-