Overlooked and Undercounted - Insight Center for Community ...
Overlooked and Undercounted - Insight Center for Community ...
Overlooked and Undercounted - Insight Center for Community ...

You also want an ePaper? Increase the reach of your titles
YUMPU automatically turns print PDFs into web optimized ePapers that Google loves.
STRUGGLING TO MAKE ENDS MEET IN MISSISSIPPI — 9<br />
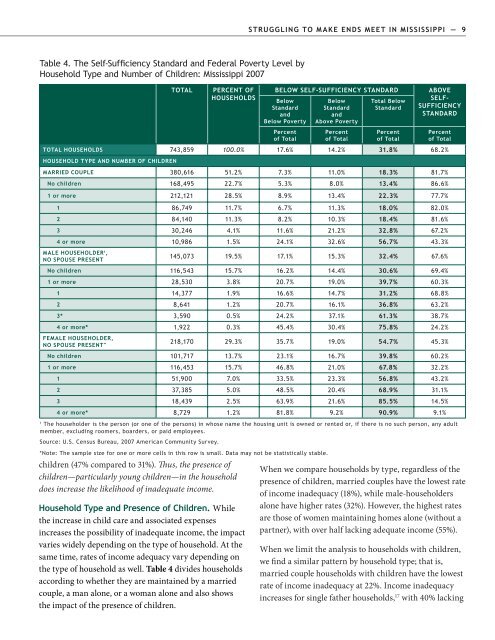
Table 4. The Self-Sufficiency St<strong>and</strong>ard <strong>and</strong> Federal Poverty Level by<br />
Household Type <strong>and</strong> Number of Children: Mississippi 2007<br />
TOTAL<br />
PERCENT OF<br />
HOUSEHOLDS<br />
children (47% compared to 31%). Thus, the presence of<br />
children—particularly young children—in the household<br />
does increase the likelihood of inadequate income.<br />
Household Type <strong>and</strong> Presence of Children. While<br />
the increase in child care <strong>and</strong> associated expenses<br />
increases the possibility of inadequate income, the impact<br />
varies widely depending on the type of household. At the<br />
same time, rates of income adequacy vary depending on<br />
the type of household as well. Table 4 divides households<br />
according to whether they are maintained by a married<br />
couple, a man alone, or a woman alone <strong>and</strong> also shows<br />
the impact of the presence of children.<br />
BELOW SELF-SUFFICIENCY STANDARD<br />
Below<br />
St<strong>and</strong>ard<br />
<strong>and</strong><br />
Below Poverty<br />
Percent<br />
of Total<br />
Below<br />
St<strong>and</strong>ard<br />
<strong>and</strong><br />
Above Poverty<br />
Percent<br />
of Total<br />
Total Below<br />
St<strong>and</strong>ard<br />
Percent<br />
of Total<br />
ABOVE<br />
SELF-<br />
SUFFICIENCY<br />
STANDARD<br />
Percent<br />
of Total<br />
TOTAL HOUSEHOLDS 743,859 100.0% 17.6% 14.2% 31.8% 68.2%<br />
HOUSEHOLD TYPE AND NUMBER OF CHILDREN<br />
MARRIED COUPLE 380,616 51.2% 7.3% 11.0% 18.3% 81.7%<br />
No children 168,495 22.7% 5.3% 8.0% 13.4% 86.6%<br />
1 or more 212,121 28.5% 8.9% 13.4% 22.3% 77.7%<br />
1 86,749 11.7% 6.7% 11.3% 18.0% 82.0%<br />
2 84,140 11.3% 8.2% 10.3% 18.4% 81.6%<br />
3 30,246 4.1% 11.6% 21.2% 32.8% 67.2%<br />
4 or more 10,986 1.5% 24.1% 32.6% 56.7% 43.3%<br />
MALE HOUSEHOLDER 1 ,<br />
NO SPOUSE PRESENT<br />
145,073 19.5% 17.1% 15.3% 32.4% 67.6%<br />
No children 116,543 15.7% 16.2% 14.4% 30.6% 69.4%<br />
1 or more 28,530 3.8% 20.7% 19.0% 39.7% 60.3%<br />
1 14,377 1.9% 16.6% 14.7% 31.2% 68.8%<br />
2 8,641 1.2% 20.7% 16.1% 36.8% 63.2%<br />
3* 3,590 0.5% 24.2% 37.1% 61.3% 38.7%<br />
4 or more* 1,922 0.3% 45.4% 30.4% 75.8% 24.2%<br />
FEMALE HOUSEHOLDER,<br />
NO SPOUSE PRESENT"<br />
218,170 29.3% 35.7% 19.0% 54.7% 45.3%<br />
No children 101,717 13.7% 23.1% 16.7% 39.8% 60.2%<br />
1 or more 116,453 15.7% 46.8% 21.0% 67.8% 32.2%<br />
1 51,900 7.0% 33.5% 23.3% 56.8% 43.2%<br />
2 37,385 5.0% 48.5% 20.4% 68.9% 31.1%<br />
3 18,439 2.5% 63.9% 21.6% 85.5% 14.5%<br />
4 or more* 8,729 1.2% 81.8% 9.2% 90.9% 9.1%<br />
1<br />
The householder is the person (or one of the persons) in whose name the housing unit is owned or rented or, if there is no such person, any adult<br />
member, excluding roomers, boarders, or paid employees.<br />
Source: U.S. Census Bureau, 2007 American <strong>Community</strong> Survey.<br />
*Note: The sample size <strong>for</strong> one or more cells in this row is small. Data may not be statistically stable.<br />
When we compare households by type, regardless of the<br />
presence of children, married couples have the lowest rate<br />
of income inadequacy (18%), while male-householders<br />
alone have higher rates (32%). However, the highest rates<br />
are those of women maintaining homes alone (without a<br />
partner), with over half lacking adequate income (55%).<br />
When we limit the analysis to households with children,<br />
we find a similar pattern by household type; that is,<br />
married couple households with children have the lowest<br />
rate of income inadequacy at 22%. Income inadequacy<br />
increases <strong>for</strong> single father households, 17 with 40% lacking