Overlooked and Undercounted - Insight Center for Community ...
Overlooked and Undercounted - Insight Center for Community ...
Overlooked and Undercounted - Insight Center for Community ...

Create successful ePaper yourself
Turn your PDF publications into a flip-book with our unique Google optimized e-Paper software.
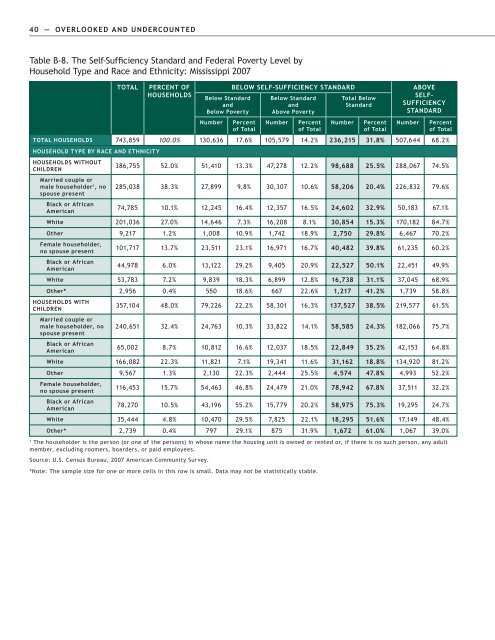
40 — OVERLOOKED AND UNDERCOUNTED<br />
Table B-8. The Self-Sufficiency St<strong>and</strong>ard <strong>and</strong> Federal Poverty Level by<br />
Household Type <strong>and</strong> Race <strong>and</strong> Ethnicity: Mississippi 2007<br />
TOTAL<br />
PERCENT OF<br />
HOUSEHOLDS<br />
Below St<strong>and</strong>ard<br />
<strong>and</strong><br />
Below Poverty<br />
Number<br />
BELOW SELF-SUFFICIENCY STANDARD<br />
Percent<br />
of Total<br />
Below St<strong>and</strong>ard<br />
<strong>and</strong><br />
Above Poverty<br />
Number<br />
Percent<br />
of Total<br />
Total Below<br />
St<strong>and</strong>ard<br />
Number<br />
Percent<br />
of Total<br />
ABOVE<br />
SELF-<br />
SUFFICIENCY<br />
STANDARD<br />
Number<br />
Percent<br />
of Total<br />
TOTAL HOUSEHOLDS 743,859 100.0% 130,636 17.6% 105,579 14.2% 236,215 31.8% 507,644 68.2%<br />
HOUSEHOLD TYPE BY RACE AND ETHNICITY<br />
HOUSEHOLDS WITHOUT<br />
CHILDREN<br />
Married couple or<br />
male householder 1 , no<br />
spouse present<br />
Black or African<br />
American<br />
386,755 52.0% 51,410 13.3% 47,278 12.2% 98,688 25.5% 288,067 74.5%<br />
285,038 38.3% 27,899 9.8% 30,307 10.6% 58,206 20.4% 226,832 79.6%<br />
74,785 10.1% 12,245 16.4% 12,357 16.5% 24,602 32.9% 50,183 67.1%<br />
White 201,036 27.0% 14,646 7.3% 16,208 8.1% 30,854 15.3% 170,182 84.7%<br />
Other 9,217 1.2% 1,008 10.9% 1,742 18.9% 2,750 29.8% 6,467 70.2%<br />
Female householder,<br />
no spouse present<br />
Black or African<br />
American<br />
101,717 13.7% 23,511 23.1% 16,971 16.7% 40,482 39.8% 61,235 60.2%<br />
44,978 6.0% 13,122 29.2% 9,405 20.9% 22,527 50.1% 22,451 49.9%<br />
White 53,783 7.2% 9,839 18.3% 6,899 12.8% 16,738 31.1% 37,045 68.9%<br />
Other* 2,956 0.4% 550 18.6% 667 22.6% 1,217 41.2% 1,739 58.8%<br />
HOUSEHOLDS WITH<br />
CHILDREN<br />
Married couple or<br />
male householder, no<br />
spouse present<br />
Black or African<br />
American<br />
357,104 48.0% 79,226 22.2% 58,301 16.3% 137,527 38.5% 219,577 61.5%<br />
240,651 32.4% 24,763 10.3% 33,822 14.1% 58,585 24.3% 182,066 75.7%<br />
65,002 8.7% 10,812 16.6% 12,037 18.5% 22,849 35.2% 42,153 64.8%<br />
White 166,082 22.3% 11,821 7.1% 19,341 11.6% 31,162 18.8% 134,920 81.2%<br />
Other 9,567 1.3% 2,130 22.3% 2,444 25.5% 4,574 47.8% 4,993 52.2%<br />
Female householder,<br />
no spouse present<br />
Black or African<br />
American<br />
116,453 15.7% 54,463 46.8% 24,479 21.0% 78,942 67.8% 37,511 32.2%<br />
78,270 10.5% 43,196 55.2% 15,779 20.2% 58,975 75.3% 19,295 24.7%<br />
White 35,444 4.8% 10,470 29.5% 7,825 22.1% 18,295 51.6% 17,149 48.4%<br />
Other* 2,739 0.4% 797 29.1% 875 31.9% 1,672 61.0% 1,067 39.0%<br />
1<br />
The householder is the person (or one of the persons) in whose name the housing unit is owned or rented or, if there is no such person, any adult<br />
member, excluding roomers, boarders, or paid employees.<br />
Source: U.S. Census Bureau, 2007 American <strong>Community</strong> Survey.<br />
*Note: The sample size <strong>for</strong> one or more cells in this row is small. Data may not be statistically stable.