Overlooked and Undercounted - Insight Center for Community ...
Overlooked and Undercounted - Insight Center for Community ...
Overlooked and Undercounted - Insight Center for Community ...

Create successful ePaper yourself
Turn your PDF publications into a flip-book with our unique Google optimized e-Paper software.
STRUGGLING TO MAKE ENDS MEET IN MISSISSIPPI — 11<br />
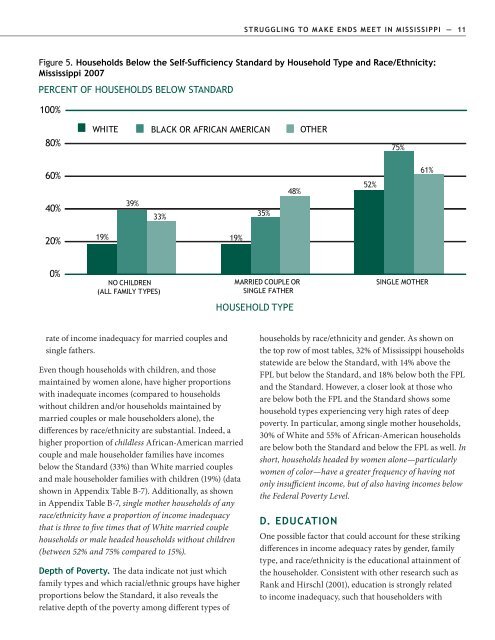
Figure 5. Households Below the Self-Sufficiency St<strong>and</strong>ard by Household Type <strong>and</strong> Race/Ethnicity:<br />
Mississippi 2007<br />
PERCENT OF HOUSEHOLDS BELOW STANDARD<br />
100%<br />
80%<br />
WHITE BLACK OR AFRICAN AMERICAN OTHER<br />
75%<br />
60%<br />
40%<br />
39%<br />
33%<br />
35%<br />
48%<br />
52%<br />
61%<br />
20%<br />
19% 19%<br />
0%<br />
NO CHILDREN<br />
(ALL FAMILY TYPES)<br />
MARRIED COUPLE OR<br />
SINGLE FATHER<br />
SINGLE MOTHER<br />
HOUSEHOLD TYPE<br />
rate of income inadequacy <strong>for</strong> married couples <strong>and</strong><br />
single fathers.<br />
Even though households with children, <strong>and</strong> those<br />
maintained by women alone, have higher proportions<br />
with inadequate incomes (compared to households<br />
without children <strong>and</strong>/or households maintained by<br />
married couples or male householders alone), the<br />
differences by race/ethnicity are substantial. Indeed, a<br />
higher proportion of childless African-American married<br />
couple <strong>and</strong> male householder families have incomes<br />
below the St<strong>and</strong>ard (33%) than White married couples<br />
<strong>and</strong> male householder families with children (19%) (data<br />
shown in Appendix Table B-7). Additionally, as shown<br />
in Appendix Table B-7, single mother households of any<br />
race/ethnicity have a proportion of income inadequacy<br />
that is three to five times that of White married couple<br />
households or male headed households without children<br />
(between 52% <strong>and</strong> 75% compared to 15%).<br />
Depth of Poverty. The data indicate not just which<br />
family types <strong>and</strong> which racial/ethnic groups have higher<br />
proportions below the St<strong>and</strong>ard, it also reveals the<br />
relative depth of the poverty among different types of<br />
households by race/ethnicity <strong>and</strong> gender. As shown on<br />
the top row of most tables, 32% of Mississippi households<br />
statewide are below the St<strong>and</strong>ard, with 14% above the<br />
FPL but below the St<strong>and</strong>ard, <strong>and</strong> 18% below both the FPL<br />
<strong>and</strong> the St<strong>and</strong>ard. However, a closer look at those who<br />
are below both the FPL <strong>and</strong> the St<strong>and</strong>ard shows some<br />
household types experiencing very high rates of deep<br />
poverty. In particular, among single mother households,<br />
30% of White <strong>and</strong> 55% of African-American households<br />
are below both the St<strong>and</strong>ard <strong>and</strong> below the FPL as well. In<br />
short, households headed by women alone—particularly<br />
women of color—have a greater frequency of having not<br />
only insufficient income, but of also having incomes below<br />
the Federal Poverty Level.<br />
D. EDUCATION<br />
One possible factor that could account <strong>for</strong> these striking<br />
differences in income adequacy rates by gender, family<br />
type, <strong>and</strong> race/ethnicity is the educational attainment of<br />
the householder. Consistent with other research such as<br />
Rank <strong>and</strong> Hirschl (2001), education is strongly related<br />
to income inadequacy, such that householders with