Overlooked and Undercounted - Insight Center for Community ...
Overlooked and Undercounted - Insight Center for Community ...
Overlooked and Undercounted - Insight Center for Community ...

Create successful ePaper yourself
Turn your PDF publications into a flip-book with our unique Google optimized e-Paper software.
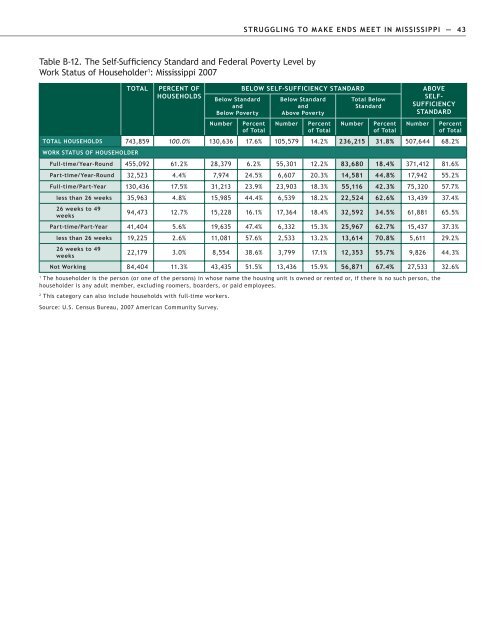
STRUGGLING TO MAKE ENDS MEET IN MISSISSIPPI — 43<br />
Table B-12. The Self-Sufficiency St<strong>and</strong>ard <strong>and</strong> Federal Poverty Level by<br />
Work Status of Householder 1 : Mississippi 2007<br />
TOTAL<br />
PERCENT OF<br />
HOUSEHOLDS<br />
Below St<strong>and</strong>ard<br />
<strong>and</strong><br />
Below Poverty<br />
Number<br />
BELOW SELF-SUFFICIENCY STANDARD<br />
Percent<br />
of Total<br />
Below St<strong>and</strong>ard<br />
<strong>and</strong><br />
Above Poverty<br />
Number<br />
Percent<br />
of Total<br />
Total Below<br />
St<strong>and</strong>ard<br />
Number<br />
Percent<br />
of Total<br />
ABOVE<br />
SELF-<br />
SUFFICIENCY<br />
STANDARD<br />
Number<br />
Percent<br />
of Total<br />
TOTAL HOUSEHOLDS 743,859 100.0% 130,636 17.6% 105,579 14.2% 236,215 31.8% 507,644 68.2%<br />
WORK STATUS OF HOUSEHOLDER<br />
Full-time/Year-Round 455,092 61.2% 28,379 6.2% 55,301 12.2% 83,680 18.4% 371,412 81.6%<br />
Part-time/Year-Round 32,523 4.4% 7,974 24.5% 6,607 20.3% 14,581 44.8% 17,942 55.2%<br />
Full-time/Part-Year 130,436 17.5% 31,213 23.9% 23,903 18.3% 55,116 42.3% 75,320 57.7%<br />
less than 26 weeks 35,963 4.8% 15,985 44.4% 6,539 18.2% 22,524 62.6% 13,439 37.4%<br />
26 weeks to 49<br />
weeks<br />
94,473 12.7% 15,228 16.1% 17,364 18.4% 32,592 34.5% 61,881 65.5%<br />
Part-time/Part-Year 41,404 5.6% 19,635 47.4% 6,332 15.3% 25,967 62.7% 15,437 37.3%<br />
less than 26 weeks 19,225 2.6% 11,081 57.6% 2,533 13.2% 13,614 70.8% 5,611 29.2%<br />
26 weeks to 49<br />
weeks<br />
22,179 3.0% 8,554 38.6% 3,799 17.1% 12,353 55.7% 9,826 44.3%<br />
Not Working 84,404 11.3% 43,435 51.5% 13,436 15.9% 56,871 67.4% 27,533 32.6%<br />
1<br />
The householder is the person (or one of the persons) in whose name the housing unit is owned or rented or, if there is no such person, the<br />
householder is any adult member, excluding roomers, boarders, or paid employees.<br />
2<br />
This category can also include households with full-time workers.<br />
Source: U.S. Census Bureau, 2007 American <strong>Community</strong> Survey.