Overlooked and Undercounted - Insight Center for Community ...
Overlooked and Undercounted - Insight Center for Community ...
Overlooked and Undercounted - Insight Center for Community ...

Create successful ePaper yourself
Turn your PDF publications into a flip-book with our unique Google optimized e-Paper software.
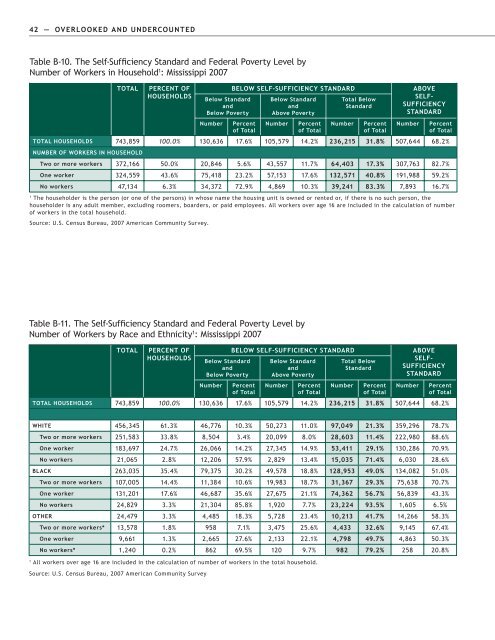
42 — OVERLOOKED AND UNDERCOUNTED<br />
Table B-10. The Self-Sufficiency St<strong>and</strong>ard <strong>and</strong> Federal Poverty Level by<br />
Number of Workers in Household 1 : Mississippi 2007<br />
TOTAL<br />
PERCENT OF<br />
HOUSEHOLDS<br />
Below St<strong>and</strong>ard<br />
<strong>and</strong><br />
Below Poverty<br />
Number<br />
BELOW SELF-SUFFICIENCY STANDARD<br />
Percent<br />
of Total<br />
Below St<strong>and</strong>ard<br />
<strong>and</strong><br />
Above Poverty<br />
Number<br />
Percent<br />
of Total<br />
Total Below<br />
St<strong>and</strong>ard<br />
Number<br />
Percent<br />
of Total<br />
ABOVE<br />
SELF-<br />
SUFFICIENCY<br />
STANDARD<br />
Number<br />
Percent<br />
of Total<br />
TOTAL HOUSEHOLDS 743,859 100.0% 130,636 17.6% 105,579 14.2% 236,215 31.8% 507,644 68.2%<br />
NUMBER OF WORKERS IN HOUSEHOLD<br />
Two or more workers 372,166 50.0% 20,846 5.6% 43,557 11.7% 64,403 17.3% 307,763 82.7%<br />
One worker 324,559 43.6% 75,418 23.2% 57,153 17.6% 132,571 40.8% 191,988 59.2%<br />
No workers 47,134 6.3% 34,372 72.9% 4,869 10.3% 39,241 83.3% 7,893 16.7%<br />
1<br />
The householder is the person (or one of the persons) in whose name the housing unit is owned or rented or, if there is no such person, the<br />
householder is any adult member, excluding roomers, boarders, or paid employees. All workers over age 16 are included in the calculation of number<br />
of workers in the total household.<br />
Source: U.S. Census Bureau, 2007 American <strong>Community</strong> Survey.<br />
Table B-11. The Self-Sufficiency St<strong>and</strong>ard <strong>and</strong> Federal Poverty Level by<br />
Number of Workers by Race <strong>and</strong> Ethnicity 1 : Mississippi 2007<br />
TOTAL<br />
PERCENT OF<br />
HOUSEHOLDS<br />
Below St<strong>and</strong>ard<br />
<strong>and</strong><br />
Below Poverty<br />
Number<br />
BELOW SELF-SUFFICIENCY STANDARD<br />
Percent<br />
of Total<br />
Below St<strong>and</strong>ard<br />
<strong>and</strong><br />
Above Poverty<br />
Number<br />
Percent<br />
of Total<br />
Total Below<br />
St<strong>and</strong>ard<br />
Number<br />
Percent<br />
of Total<br />
ABOVE<br />
SELF-<br />
SUFFICIENCY<br />
STANDARD<br />
Number<br />
Percent<br />
of Total<br />
TOTAL HOUSEHOLDS 743,859 100.0% 130,636 17.6% 105,579 14.2% 236,215 31.8% 507,644 68.2%<br />
WHITE 456,345 61.3% 46,776 10.3% 50,273 11.0% 97,049 21.3% 359,296 78.7%<br />
Two or more workers 251,583 33.8% 8,504 3.4% 20,099 8.0% 28,603 11.4% 222,980 88.6%<br />
One worker 183,697 24.7% 26,066 14.2% 27,345 14.9% 53,411 29.1% 130,286 70.9%<br />
No workers 21,065 2.8% 12,206 57.9% 2,829 13.4% 15,035 71.4% 6,030 28.6%<br />
BLACK 263,035 35.4% 79,375 30.2% 49,578 18.8% 128,953 49.0% 134,082 51.0%<br />
Two or more workers 107,005 14.4% 11,384 10.6% 19,983 18.7% 31,367 29.3% 75,638 70.7%<br />
One worker 131,201 17.6% 46,687 35.6% 27,675 21.1% 74,362 56.7% 56,839 43.3%<br />
No workers 24,829 3.3% 21,304 85.8% 1,920 7.7% 23,224 93.5% 1,605 6.5%<br />
OTHER 24,479 3.3% 4,485 18.3% 5,728 23.4% 10,213 41.7% 14,266 58.3%<br />
Two or more workers* 13,578 1.8% 958 7.1% 3,475 25.6% 4,433 32.6% 9,145 67.4%<br />
One worker 9,661 1.3% 2,665 27.6% 2,133 22.1% 4,798 49.7% 4,863 50.3%<br />
No workers* 1,240 0.2% 862 69.5% 120 9.7% 982 79.2% 258 20.8%<br />
1<br />
All workers over age 16 are included in the calculation of number of workers in the total household.<br />
Source: U.S. Census Bureau, 2007 American <strong>Community</strong> Survey