Overlooked and Undercounted - Insight Center for Community ...
Overlooked and Undercounted - Insight Center for Community ...
Overlooked and Undercounted - Insight Center for Community ...

Create successful ePaper yourself
Turn your PDF publications into a flip-book with our unique Google optimized e-Paper software.
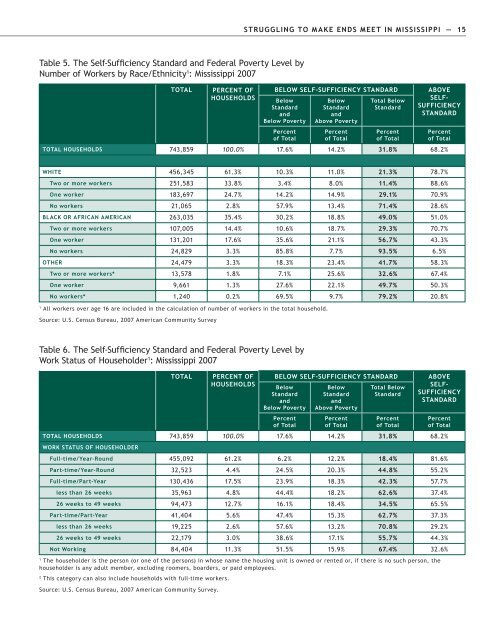
STRUGGLING TO MAKE ENDS MEET IN MISSISSIPPI — 15<br />
Table 5. The Self-Sufficiency St<strong>and</strong>ard <strong>and</strong> Federal Poverty Level by<br />
Number of Workers by Race/Ethnicity 1 : Mississippi 2007<br />
TOTAL<br />
PERCENT OF<br />
HOUSEHOLDS<br />
BELOW SELF-SUFFICIENCY STANDARD<br />
Below<br />
St<strong>and</strong>ard<br />
<strong>and</strong><br />
Below Poverty<br />
Percent<br />
of Total<br />
Below<br />
St<strong>and</strong>ard<br />
<strong>and</strong><br />
Above Poverty<br />
Percent<br />
of Total<br />
Total Below<br />
St<strong>and</strong>ard<br />
Percent<br />
of Total<br />
ABOVE<br />
SELF-<br />
SUFFICIENCY<br />
STANDARD<br />
Percent<br />
of Total<br />
TOTAL HOUSEHOLDS 743,859 100.0% 17.6% 14.2% 31.8% 68.2%<br />
WHITE 456,345 61.3% 10.3% 11.0% 21.3% 78.7%<br />
Two or more workers 251,583 33.8% 3.4% 8.0% 11.4% 88.6%<br />
One worker 183,697 24.7% 14.2% 14.9% 29.1% 70.9%<br />
No workers 21,065 2.8% 57.9% 13.4% 71.4% 28.6%<br />
BLACK OR AFRICAN AMERICAN 263,035 35.4% 30.2% 18.8% 49.0% 51.0%<br />
Two or more workers 107,005 14.4% 10.6% 18.7% 29.3% 70.7%<br />
One worker 131,201 17.6% 35.6% 21.1% 56.7% 43.3%<br />
No workers 24,829 3.3% 85.8% 7.7% 93.5% 6.5%<br />
OTHER 24,479 3.3% 18.3% 23.4% 41.7% 58.3%<br />
Two or more workers* 13,578 1.8% 7.1% 25.6% 32.6% 67.4%<br />
One worker 9,661 1.3% 27.6% 22.1% 49.7% 50.3%<br />
No workers* 1,240 0.2% 69.5% 9.7% 79.2% 20.8%<br />
1<br />
All workers over age 16 are included in the calculation of number of workers in the total household.<br />
Source: U.S. Census Bureau, 2007 American <strong>Community</strong> Survey<br />
Table 6. The Self-Sufficiency St<strong>and</strong>ard <strong>and</strong> Federal Poverty Level by<br />
Work Status of Householder 1 : Mississippi 2007<br />
TOTAL<br />
PERCENT OF<br />
HOUSEHOLDS<br />
BELOW SELF-SUFFICIENCY STANDARD<br />
Below<br />
St<strong>and</strong>ard<br />
<strong>and</strong><br />
Below Poverty<br />
Percent<br />
of Total<br />
Below<br />
St<strong>and</strong>ard<br />
<strong>and</strong><br />
Above Poverty<br />
Percent<br />
of Total<br />
Total Below<br />
St<strong>and</strong>ard<br />
Percent<br />
of Total<br />
ABOVE<br />
SELF-<br />
SUFFICIENCY<br />
STANDARD<br />
Percent<br />
of Total<br />
TOTAL HOUSEHOLDS 743,859 100.0% 17.6% 14.2% 31.8% 68.2%<br />
WORK STATUS OF HOUSEHOLDER<br />
Full-time/Year-Round 455,092 61.2% 6.2% 12.2% 18.4% 81.6%<br />
Part-time/Year-Round 32,523 4.4% 24.5% 20.3% 44.8% 55.2%<br />
Full-time/Part-Year 130,436 17.5% 23.9% 18.3% 42.3% 57.7%<br />
less than 26 weeks 35,963 4.8% 44.4% 18.2% 62.6% 37.4%<br />
26 weeks to 49 weeks 94,473 12.7% 16.1% 18.4% 34.5% 65.5%<br />
Part-time/Part-Year 41,404 5.6% 47.4% 15.3% 62.7% 37.3%<br />
less than 26 weeks 19,225 2.6% 57.6% 13.2% 70.8% 29.2%<br />
26 weeks to 49 weeks 22,179 3.0% 38.6% 17.1% 55.7% 44.3%<br />
Not Working 84,404 11.3% 51.5% 15.9% 67.4% 32.6%<br />
1<br />
The householder is the person (or one of the persons) in whose name the housing unit is owned or rented or, if there is no such person, the<br />
householder is any adult member, excluding roomers, boarders, or paid employees.<br />
2<br />
This category can also include households with full-time workers.<br />
Source: U.S. Census Bureau, 2007 American <strong>Community</strong> Survey.