Overlooked and Undercounted - Insight Center for Community ...
Overlooked and Undercounted - Insight Center for Community ...
Overlooked and Undercounted - Insight Center for Community ...

You also want an ePaper? Increase the reach of your titles
YUMPU automatically turns print PDFs into web optimized ePapers that Google loves.
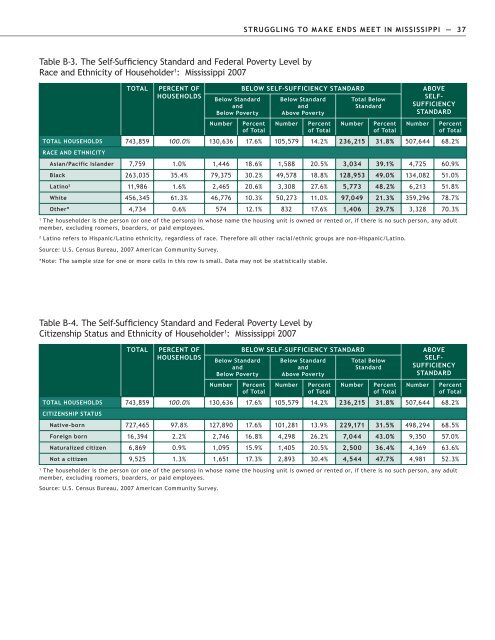
STRUGGLING TO MAKE ENDS MEET IN MISSISSIPPI — 37<br />
Table B-3. The Self-Sufficiency St<strong>and</strong>ard <strong>and</strong> Federal Poverty Level by<br />
Race <strong>and</strong> Ethnicity of Householder 1 : Mississippi 2007<br />
TOTAL<br />
PERCENT OF<br />
HOUSEHOLDS<br />
Below St<strong>and</strong>ard<br />
<strong>and</strong><br />
Below Poverty<br />
Number<br />
BELOW SELF-SUFFICIENCY STANDARD<br />
Percent<br />
of Total<br />
Below St<strong>and</strong>ard<br />
<strong>and</strong><br />
Above Poverty<br />
Number<br />
Percent<br />
of Total<br />
Total Below<br />
St<strong>and</strong>ard<br />
Number<br />
Percent<br />
of Total<br />
ABOVE<br />
SELF-<br />
SUFFICIENCY<br />
STANDARD<br />
Number<br />
Percent<br />
of Total<br />
TOTAL HOUSEHOLDS 743,859 100.0% 130,636 17.6% 105,579 14.2% 236,215 31.8% 507,644 68.2%<br />
RACE AND ETHNICITY<br />
Asian/Pacific Isl<strong>and</strong>er 7,759 1.0% 1,446 18.6% 1,588 20.5% 3,034 39.1% 4,725 60.9%<br />
Black 263,035 35.4% 79,375 30.2% 49,578 18.8% 128,953 49.0% 134,082 51.0%<br />
Latino 2 11,986 1.6% 2,465 20.6% 3,308 27.6% 5,773 48.2% 6,213 51.8%<br />
White 456,345 61.3% 46,776 10.3% 50,273 11.0% 97,049 21.3% 359,296 78.7%<br />
Other* 4,734 0.6% 574 12.1% 832 17.6% 1,406 29.7% 3,328 70.3%<br />
1<br />
The householder is the person (or one of the persons) in whose name the housing unit is owned or rented or, if there is no such person, any adult<br />
member, excluding roomers, boarders, or paid employees.<br />
2<br />
Latino refers to Hispanic/Latino ethnicity, regardless of race. There<strong>for</strong>e all other racial/ethnic groups are non-Hispanic/Latino.<br />
Source: U.S. Census Bureau, 2007 American <strong>Community</strong> Survey.<br />
*Note: The sample size <strong>for</strong> one or more cells in this row is small. Data may not be statistically stable.<br />
Table B-4. The Self-Sufficiency St<strong>and</strong>ard <strong>and</strong> Federal Poverty Level by<br />
Citizenship Status <strong>and</strong> Ethnicity of Householder 1 : Mississippi 2007<br />
TOTAL<br />
PERCENT OF<br />
HOUSEHOLDS<br />
Below St<strong>and</strong>ard<br />
<strong>and</strong><br />
Below Poverty<br />
Number<br />
BELOW SELF-SUFFICIENCY STANDARD<br />
Percent<br />
of Total<br />
Below St<strong>and</strong>ard<br />
<strong>and</strong><br />
Above Poverty<br />
Number<br />
Percent<br />
of Total<br />
Total Below<br />
St<strong>and</strong>ard<br />
Number<br />
Percent<br />
of Total<br />
ABOVE<br />
SELF-<br />
SUFFICIENCY<br />
STANDARD<br />
Number<br />
Percent<br />
of Total<br />
TOTAL HOUSEHOLDS 743,859 100.0% 130,636 17.6% 105,579 14.2% 236,215 31.8% 507,644 68.2%<br />
CITIZENSHIP STATUS<br />
Native-born 727,465 97.8% 127,890 17.6% 101,281 13.9% 229,171 31.5% 498,294 68.5%<br />
Foreign born 16,394 2.2% 2,746 16.8% 4,298 26.2% 7,044 43.0% 9,350 57.0%<br />
Naturalized citizen 6,869 0.9% 1,095 15.9% 1,405 20.5% 2,500 36.4% 4,369 63.6%<br />
Not a citizen 9,525 1.3% 1,651 17.3% 2,893 30.4% 4,544 47.7% 4,981 52.3%<br />
1<br />
The householder is the person (or one of the persons) in whose name the housing unit is owned or rented or, if there is no such person, any adult<br />
member, excluding roomers, boarders, or paid employees.<br />
Source: U.S. Census Bureau, 2007 American <strong>Community</strong> Survey.