Overlooked and Undercounted - Insight Center for Community ...
Overlooked and Undercounted - Insight Center for Community ...
Overlooked and Undercounted - Insight Center for Community ...

Create successful ePaper yourself
Turn your PDF publications into a flip-book with our unique Google optimized e-Paper software.
STRUGGLING TO MAKE ENDS MEET IN MISSISSIPPI — 21<br />
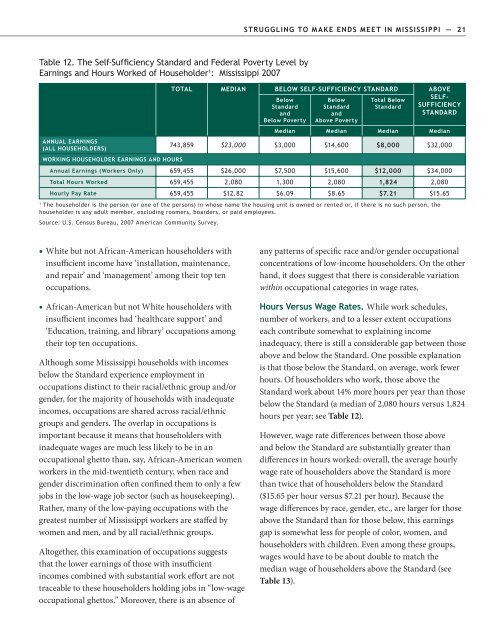
Table 12. The Self-Sufficiency St<strong>and</strong>ard <strong>and</strong> Federal Poverty Level by<br />
Earnings <strong>and</strong> Hours Worked of Householder 1 : Mississippi 2007<br />
ANNUAL EARNINGS<br />
(ALL HOUSEHOLDERS)<br />
TOTAL MEDIAN BELOW SELF-SUFFICIENCY STANDARD ABOVE<br />
Below<br />
St<strong>and</strong>ard<br />
<strong>and</strong><br />
Below Poverty<br />
Below<br />
St<strong>and</strong>ard<br />
<strong>and</strong><br />
Above Poverty<br />
Total Below<br />
St<strong>and</strong>ard<br />
SELF-<br />
SUFFICIENCY<br />
STANDARD<br />
Median Median Median Median<br />
743,859 $23,000 $3,000 $14,600 $8,000 $32,000<br />
WORKING HOUSEHOLDER EARNINGS AND HOURS<br />
Annual Earnings (Workers Only) 659,455 $26,000 $7,500 $15,600 $12,000 $34,000<br />
Total Hours Worked 659,455 2,080 1,300 2,080 1,824 2,080<br />
Hourly Pay Rate 659,455 $12.82 $6.09 $8.65 $7.21 $15.65<br />
1<br />
The householder is the person (or one of the persons) in whose name the housing unit is owned or rented or, if there is no such person, the<br />
householder is any adult member, excluding roomers, boarders, or paid employees.<br />
Source: U.S. Census Bureau, 2007 American <strong>Community</strong> Survey.<br />
White but not African-American householders with<br />
insufficient income have ‘installation, maintenance,<br />
<strong>and</strong> repair’ <strong>and</strong> ‘management’ among their top ten<br />
occupations.<br />
African-American but not White householders with<br />
insufficient incomes had ‘healthcare support’ <strong>and</strong><br />
‘Education, training, <strong>and</strong> library’ occupations among<br />
their top ten occupations.<br />
Although some Mississippi households with incomes<br />
below the St<strong>and</strong>ard experience employment in<br />
occupations distinct to their racial/ethnic group <strong>and</strong>/or<br />
gender, <strong>for</strong> the majority of households with inadequate<br />
incomes, occupations are shared across racial/ethnic<br />
groups <strong>and</strong> genders. The overlap in occupations is<br />
important because it means that householders with<br />
inadequate wages are much less likely to be in an<br />
occupational ghetto than, say, African-American women<br />
workers in the mid-twentieth century, when race <strong>and</strong><br />
gender discrimination often confined them to only a few<br />
jobs in the low-wage job sector (such as housekeeping).<br />
Rather, many of the low-paying occupations with the<br />
greatest number of Mississippi workers are staffed by<br />
women <strong>and</strong> men, <strong>and</strong> by all racial/ethnic groups.<br />
Altogether, this examination of occupations suggests<br />
that the lower earnings of those with insufficient<br />
incomes combined with substantial work ef<strong>for</strong>t are not<br />
traceable to these householders holding jobs in “low-wage<br />
occupational ghettos.” Moreover, there is an absence of<br />
any patterns of specific race <strong>and</strong>/or gender occupational<br />
concentrations of low-income householders. On the other<br />
h<strong>and</strong>, it does suggest that there is considerable variation<br />
within occupational categories in wage rates.<br />
Hours Versus Wage Rates. While work schedules,<br />
number of workers, <strong>and</strong> to a lesser extent occupations<br />
each contribute somewhat to explaining income<br />
inadequacy, there is still a considerable gap between those<br />
above <strong>and</strong> below the St<strong>and</strong>ard. One possible explanation<br />
is that those below the St<strong>and</strong>ard, on average, work fewer<br />
hours. Of householders who work, those above the<br />
St<strong>and</strong>ard work about 14% more hours per year than those<br />
below the St<strong>and</strong>ard (a median of 2,080 hours versus 1,824<br />
hours per year; see Table 12).<br />
However, wage rate differences between those above<br />
<strong>and</strong> below the St<strong>and</strong>ard are substantially greater than<br />
differences in hours worked: overall, the average hourly<br />
wage rate of householders above the St<strong>and</strong>ard is more<br />
than twice that of householders below the St<strong>and</strong>ard<br />
($15.65 per hour versus $7.21 per hour). Because the<br />
wage differences by race, gender, etc., are larger <strong>for</strong> those<br />
above the St<strong>and</strong>ard than <strong>for</strong> those below, this earnings<br />
gap is somewhat less <strong>for</strong> people of color, women, <strong>and</strong><br />
householders with children. Even among these groups,<br />
wages would have to be about double to match the<br />
median wage of householders above the St<strong>and</strong>ard (see<br />
Table 13).