Overlooked and Undercounted - Insight Center for Community ...
Overlooked and Undercounted - Insight Center for Community ...
Overlooked and Undercounted - Insight Center for Community ...

Create successful ePaper yourself
Turn your PDF publications into a flip-book with our unique Google optimized e-Paper software.
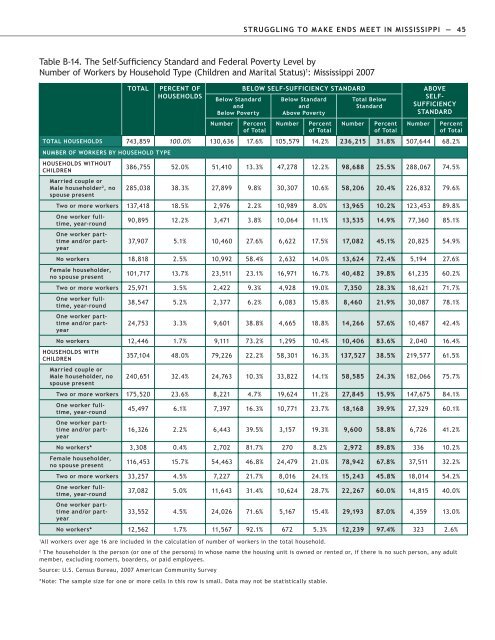
STRUGGLING TO MAKE ENDS MEET IN MISSISSIPPI — 45<br />
Table B-14. The Self-Sufficiency St<strong>and</strong>ard <strong>and</strong> Federal Poverty Level by<br />
Number of Workers by Household Type (Children <strong>and</strong> Marital Status) 1 : Mississippi 2007<br />
TOTAL<br />
PERCENT OF<br />
HOUSEHOLDS<br />
Below St<strong>and</strong>ard<br />
<strong>and</strong><br />
Below Poverty<br />
Number<br />
BELOW SELF-SUFFICIENCY STANDARD<br />
Percent<br />
of Total<br />
Below St<strong>and</strong>ard<br />
<strong>and</strong><br />
Above Poverty<br />
Number<br />
Percent<br />
of Total<br />
Total Below<br />
St<strong>and</strong>ard<br />
Number<br />
Percent<br />
of Total<br />
ABOVE<br />
SELF-<br />
SUFFICIENCY<br />
STANDARD<br />
Number<br />
Percent<br />
of Total<br />
TOTAL HOUSEHOLDS 743,859 100.0% 130,636 17.6% 105,579 14.2% 236,215 31.8% 507,644 68.2%<br />
NUMBER OF WORKERS BY HOUSEHOLD TYPE<br />
HOUSEHOLDS WITHOUT<br />
CHILDREN<br />
Married couple or<br />
Male householder 2 , no<br />
spouse present<br />
386,755 52.0% 51,410 13.3% 47,278 12.2% 98,688 25.5% 288,067 74.5%<br />
285,038 38.3% 27,899 9.8% 30,307 10.6% 58,206 20.4% 226,832 79.6%<br />
Two or more workers 137,418 18.5% 2,976 2.2% 10,989 8.0% 13,965 10.2% 123,453 89.8%<br />
One worker fulltime,<br />
year-round<br />
One worker parttime<br />
<strong>and</strong>/or partyear<br />
90,895 12.2% 3,471 3.8% 10,064 11.1% 13,535 14.9% 77,360 85.1%<br />
37,907 5.1% 10,460 27.6% 6,622 17.5% 17,082 45.1% 20,825 54.9%<br />
No workers 18,818 2.5% 10,992 58.4% 2,632 14.0% 13,624 72.4% 5,194 27.6%<br />
Female householder,<br />
no spouse present<br />
101,717 13.7% 23,511 23.1% 16,971 16.7% 40,482 39.8% 61,235 60.2%<br />
Two or more workers 25,971 3.5% 2,422 9.3% 4,928 19.0% 7,350 28.3% 18,621 71.7%<br />
One worker fulltime,<br />
year-round<br />
One worker parttime<br />
<strong>and</strong>/or partyear<br />
38,547 5.2% 2,377 6.2% 6,083 15.8% 8,460 21.9% 30,087 78.1%<br />
24,753 3.3% 9,601 38.8% 4,665 18.8% 14,266 57.6% 10,487 42.4%<br />
No workers 12,446 1.7% 9,111 73.2% 1,295 10.4% 10,406 83.6% 2,040 16.4%<br />
HOUSEHOLDS WITH<br />
CHILDREN<br />
Married couple or<br />
Male householder, no<br />
spouse present<br />
357,104 48.0% 79,226 22.2% 58,301 16.3% 137,527 38.5% 219,577 61.5%<br />
240,651 32.4% 24,763 10.3% 33,822 14.1% 58,585 24.3% 182,066 75.7%<br />
Two or more workers 175,520 23.6% 8,221 4.7% 19,624 11.2% 27,845 15.9% 147,675 84.1%<br />
One worker fulltime,<br />
year-round<br />
One worker parttime<br />
<strong>and</strong>/or partyear<br />
45,497 6.1% 7,397 16.3% 10,771 23.7% 18,168 39.9% 27,329 60.1%<br />
16,326 2.2% 6,443 39.5% 3,157 19.3% 9,600 58.8% 6,726 41.2%<br />
No workers* 3,308 0.4% 2,702 81.7% 270 8.2% 2,972 89.8% 336 10.2%<br />
Female householder,<br />
no spouse present<br />
116,453 15.7% 54,463 46.8% 24,479 21.0% 78,942 67.8% 37,511 32.2%<br />
Two or more workers 33,257 4.5% 7,227 21.7% 8,016 24.1% 15,243 45.8% 18,014 54.2%<br />
One worker fulltime,<br />
year-round<br />
One worker parttime<br />
<strong>and</strong>/or partyear<br />
37,082 5.0% 11,643 31.4% 10,624 28.7% 22,267 60.0% 14,815 40.0%<br />
33,552 4.5% 24,026 71.6% 5,167 15.4% 29,193 87.0% 4,359 13.0%<br />
No workers* 12,562 1.7% 11,567 92.1% 672 5.3% 12,239 97.4% 323 2.6%<br />
1<br />
All workers over age 16 are included in the calculation of number of workers in the total household.<br />
2<br />
The householder is the person (or one of the persons) in whose name the housing unit is owned or rented or, if there is no such person, any adult<br />
member, excluding roomers, boarders, or paid employees.<br />
Source: U.S. Census Bureau, 2007 American <strong>Community</strong> Survey<br />
*Note: The sample size <strong>for</strong> one or more cells in this row is small. Data may not be statistically stable.