Overlooked and Undercounted - Insight Center for Community ...
Overlooked and Undercounted - Insight Center for Community ...
Overlooked and Undercounted - Insight Center for Community ...

You also want an ePaper? Increase the reach of your titles
YUMPU automatically turns print PDFs into web optimized ePapers that Google loves.
18 — OVERLOOKED AND UNDERCOUNTED<br />
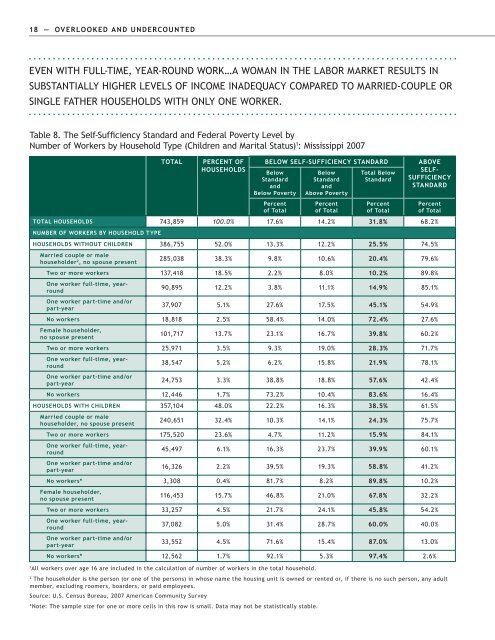
EVEN WITH FULL-TIME, YEAR-ROUND WORK…A WOMAN IN THE LABOR MARKET RESULTS IN<br />
SUBSTANTIALLY HIGHER LEVELS OF INCOME INADEQUACY COMPARED TO MARRIED-COUPLE OR<br />
SINGLE FATHER HOUSEHOLDS WITH ONLY ONE WORKER.<br />
Table 8. The Self-Sufficiency St<strong>and</strong>ard <strong>and</strong> Federal Poverty Level by<br />
Number of Workers by Household Type (Children <strong>and</strong> Marital Status) 1 : Mississippi 2007<br />
TOTAL<br />
PERCENT OF<br />
HOUSEHOLDS<br />
BELOW SELF-SUFFICIENCY STANDARD<br />
Below<br />
St<strong>and</strong>ard<br />
<strong>and</strong><br />
Below Poverty<br />
Percent<br />
of Total<br />
Below<br />
St<strong>and</strong>ard<br />
<strong>and</strong><br />
Above Poverty<br />
Percent<br />
of Total<br />
Total Below<br />
St<strong>and</strong>ard<br />
Percent<br />
of Total<br />
ABOVE<br />
SELF-<br />
SUFFICIENCY<br />
STANDARD<br />
Percent<br />
of Total<br />
TOTAL HOUSEHOLDS 743,859 100.0% 17.6% 14.2% 31.8% 68.2%<br />
NUMBER OF WORKERS BY HOUSEHOLD TYPE<br />
HOUSEHOLDS WITHOUT CHILDREN 386,755 52.0% 13.3% 12.2% 25.5% 74.5%<br />
Married couple or male<br />
householder 2 , no spouse present<br />
285,038 38.3% 9.8% 10.6% 20.4% 79.6%<br />
Two or more workers 137,418 18.5% 2.2% 8.0% 10.2% 89.8%<br />
One worker full-time, yearround<br />
One worker part-time <strong>and</strong>/or<br />
part-year<br />
90,895 12.2% 3.8% 11.1% 14.9% 85.1%<br />
37,907 5.1% 27.6% 17.5% 45.1% 54.9%<br />
No workers 18,818 2.5% 58.4% 14.0% 72.4% 27.6%<br />
Female householder,<br />
no spouse present<br />
101,717 13.7% 23.1% 16.7% 39.8% 60.2%<br />
Two or more workers 25,971 3.5% 9.3% 19.0% 28.3% 71.7%<br />
One worker full-time, yearround<br />
One worker part-time <strong>and</strong>/or<br />
part-year<br />
38,547 5.2% 6.2% 15.8% 21.9% 78.1%<br />
24,753 3.3% 38.8% 18.8% 57.6% 42.4%<br />
No workers 12,446 1.7% 73.2% 10.4% 83.6% 16.4%<br />
HOUSEHOLDS WITH CHILDREN 357,104 48.0% 22.2% 16.3% 38.5% 61.5%<br />
Married couple or male<br />
householder, no spouse present<br />
240,651 32.4% 10.3% 14.1% 24.3% 75.7%<br />
Two or more workers 175,520 23.6% 4.7% 11.2% 15.9% 84.1%<br />
One worker full-time, yearround<br />
One worker part-time <strong>and</strong>/or<br />
part-year<br />
45,497 6.1% 16.3% 23.7% 39.9% 60.1%<br />
16,326 2.2% 39.5% 19.3% 58.8% 41.2%<br />
No workers* 3,308 0.4% 81.7% 8.2% 89.8% 10.2%<br />
Female householder,<br />
no spouse present<br />
116,453 15.7% 46.8% 21.0% 67.8% 32.2%<br />
Two or more workers 33,257 4.5% 21.7% 24.1% 45.8% 54.2%<br />
One worker full-time, yearround<br />
One worker part-time <strong>and</strong>/or<br />
part-year<br />
37,082 5.0% 31.4% 28.7% 60.0% 40.0%<br />
33,552 4.5% 71.6% 15.4% 87.0% 13.0%<br />
No workers* 12,562 1.7% 92.1% 5.3% 97.4% 2.6%<br />
1<br />
All workers over age 16 are included in the calculation of number of workers in the total household.<br />
2<br />
The householder is the person (or one of the persons) in whose name the housing unit is owned or rented or, if there is no such person, any adult<br />
member, excluding roomers, boarders, or paid employees.<br />
Source: U.S. Census Bureau, 2007 American <strong>Community</strong> Survey<br />
*Note: The sample size <strong>for</strong> one or more cells in this row is small. Data may not be statistically stable.