

Applying OLAP Pre-Aggregation Techniques to ... - Jacobs University
Applying OLAP Pre-Aggregation Techniques to ... - Jacobs University
Applying OLAP Pre-Aggregation Techniques to ... - Jacobs University

Create successful ePaper yourself
Turn your PDF publications into a flip-book with our unique Google optimized e-Paper software.
94 5. <strong>Pre</strong>-<strong>Aggregation</strong> Support Beyond Basic Aggregate Operations<br />
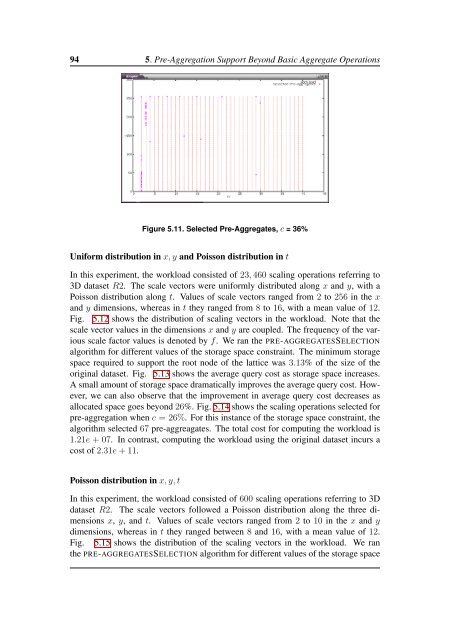
Figure 5.11. Selected <strong>Pre</strong>-Aggregates, c = 36%<br />
Uniform distribution in x, y and Poisson distribution in t<br />
In this experiment, the workload consisted of 23, 460 scaling operations referring <strong>to</strong><br />
3D dataset R2. The scale vec<strong>to</strong>rs were uniformly distributed along x and y, with a<br />
Poisson distribution along t. Values of scale vec<strong>to</strong>rs ranged from 2 <strong>to</strong> 256 in the x<br />
and y dimensions, whereas in t they ranged from 8 <strong>to</strong> 16, with a mean value of 12.<br />
Fig. 5.12 shows the distribution of scaling vec<strong>to</strong>rs in the workload. Note that the<br />
scale vec<strong>to</strong>r values in the dimensions x and y are coupled. The frequency of the various<br />
scale fac<strong>to</strong>r values is denoted by f. We ran the PRE-AGGREGATESSELECTION<br />
algorithm for different values of the s<strong>to</strong>rage space constraint. The minimum s<strong>to</strong>rage<br />
space required <strong>to</strong> support the root node of the lattice was 3.13% of the size of the<br />
original dataset. Fig. 5.13 shows the average query cost as s<strong>to</strong>rage space increases.<br />
A small amount of s<strong>to</strong>rage space dramatically improves the average query cost. However,<br />
we can also observe that the improvement in average query cost decreases as<br />
allocated space goes beyond 26%. Fig. 5.14 shows the scaling operations selected for<br />
pre-aggregation when c = 26%. For this instance of the s<strong>to</strong>rage space constraint, the<br />
algorithm selected 67 pre-aggreagates. The <strong>to</strong>tal cost for computing the workload is<br />
1.21e + 07. In contrast, computing the workload using the original dataset incurs a<br />
cost of 2.31e + 11.<br />
Poisson distribution in x, y, t<br />
In this experiment, the workload consisted of 600 scaling operations referring <strong>to</strong> 3D<br />
dataset R2. The scale vec<strong>to</strong>rs followed a Poisson distribution along the three dimensions<br />
x, y, and t. Values of scale vec<strong>to</strong>rs ranged from 2 <strong>to</strong> 10 in the x and y<br />
dimensions, whereas in t they ranged between 8 and 16, with a mean value of 12.<br />
Fig. 5.15 shows the distribution of the scaling vec<strong>to</strong>rs in the workload. We ran<br />
the PRE-AGGREGATESSELECTION algorithm for different values of the s<strong>to</strong>rage space


