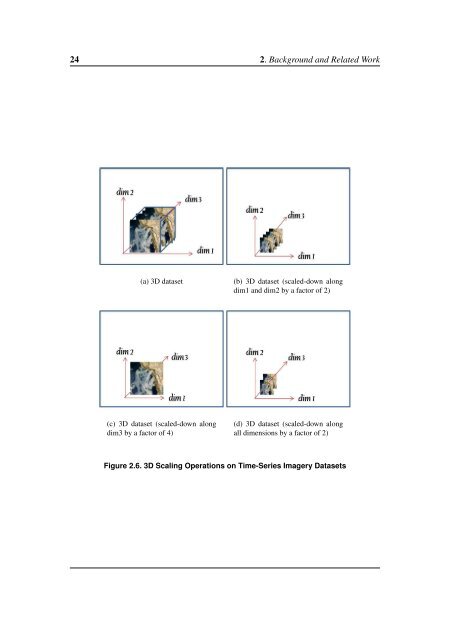
24 2. Background and Related Work (a) 3D dataset (b) 3D dataset (scaled-down along dim1 and dim2 by a fac<strong>to</strong>r of 2) (c) 3D dataset (scaled-down along dim3 by a fac<strong>to</strong>r of 4) (d) 3D dataset (scaled-down along all dimensions by a fac<strong>to</strong>r of 2) Figure 2.6. 3D Scaling Operations on Time-Series Imagery Datasets
2.2 On-Line Analytical Processing (<strong>OLAP</strong>) 25 2.1.7 Summary Array database theory is gradually entering its consolidation phase. The notion of arrays as functions mapping points of some hypercube-shaped domain <strong>to</strong> values of some range set is commonly accepted. Two main modeling paradigms are used: calculus and algebra. Multidimensional data models embed arrays in<strong>to</strong> the relational world, either by providing conceptual stubs like Array Algebra, or by adding relational capabilities explicitly such as AQL and RAM. Notably, aggregate query processing plays a critical role given the large volumes of the arrays. Our study shows that pre-aggregation techniques focus only on 2D datasets, and that support is limited <strong>to</strong> one particular operation: scaling. We distinguish the pyramid approach as the most popular method for speeding up scaling operations on 2D datasets; despite its known limitations such as hard-wired interpolation and lack of support for datasets of higher dimensions. Advances on hardware graphics are enabling quicker and more accurate visualization and navigation capabilities for raster imagery. However, little work has been reported on how array database technology is progressively exploiting these hardware advances. A critical gap with respect <strong>to</strong> pre-aggregation is the lack of support for aggregate operations other than 2D scaling. 2.2 On-Line Analytical Processing (<strong>OLAP</strong>) Data warehousing/<strong>OLAP</strong> is an application domain where complex multidimensional aggregates on large databases have been studied intensively. Typically, a data warehouse collects business data from one or multiple sources so that the desired financial, marketing, and business analyses can be performed. These kinds of analyses can detect trends and anomalies, make projections, and make business decisions [41]. When such analysis predominantly involves aggregate queries, it is called on-line analytical processing, or <strong>OLAP</strong> [38, 39]. To understand the mechanism of pre-computation, the following subsections review different approaches <strong>to</strong> structuring multidimensional data, s<strong>to</strong>rage mechanisms and operations in <strong>OLAP</strong>. 2.2.1 <strong>OLAP</strong> Data model The multidimensional <strong>OLAP</strong> model begins with the observation that the fac<strong>to</strong>rs that influence decision-making processes are related <strong>to</strong> enterprise-specific facts, such as sales, shipments, hospital admissions, surgeries, and so on. [68]. Instances of a fact subsequently correspond <strong>to</strong> events that occur. For example, every sale or shipment carried out is an event. Each fact is described by the values of a set of relevant measures providing quantitative descriptions of events, e.g., sales receipts, amounts shipped, hospital admission costs, and surgery times are all measures. In <strong>OLAP</strong>, information is viewed conceptually as cubes that consist of descriptive categories (dimensions) and quantitative values (measures) [26, 81, 69, 83]. In the scientific literature, measures are at times called variables, metrics, properties, attributes, or indica<strong>to</strong>rs. Figure 2.7 illustrates a 3D <strong>OLAP</strong> data cube where business events