

Applying OLAP Pre-Aggregation Techniques to ... - Jacobs University
Applying OLAP Pre-Aggregation Techniques to ... - Jacobs University
Applying OLAP Pre-Aggregation Techniques to ... - Jacobs University

You also want an ePaper? Increase the reach of your titles
YUMPU automatically turns print PDFs into web optimized ePapers that Google loves.
74 4. Answering Basic Aggregate Queries Using <strong>Pre</strong>-Aggregated Data<br />
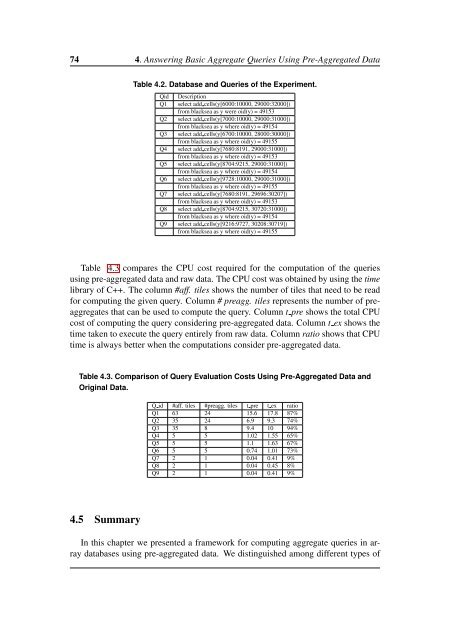
Table 4.2. Database and Queries of the Experiment.<br />
Qid Description<br />
Q1 select add cells(y[6000:10000, 29000:32000])<br />
from blacksea as y were oid(y) = 49153<br />
Q2 select add cells(y[7000:10000, 29000:31000])<br />
from blacksea as y where oid(y) = 49154<br />
Q3 select add cells(y[6700:10000, 28000:30000])<br />
from blacksea as y where oid(y) = 49155<br />
Q4 select add cells(y[7680:8191, 29000:31000])<br />
from blacksea as y where oid(y) = 49153<br />
Q5 select add cells(y[8704:9215, 29000:31000])<br />
from blacksea as y where oid(y) = 49154<br />
Q6 select add cells(y[9728:10000, 29000:31000])<br />
from blacksea as y where oid(y) = 49155<br />
Q7 select add cells(y[7680:8191, 29696:30207])<br />
from blacksea as y where oid(y) = 49153<br />
Q8 select add cells(y[8704:9215, 30720:31000])<br />
from blacksea as y where oid(y) = 49154<br />
Q9 select add cells(y[9216:9727, 30208:30719])<br />
from blacksea as y where oid(y) = 49155<br />
Table 4.3 compares the CPU cost required for the computation of the queries<br />
using pre-aggregated data and raw data. The CPU cost was obtained by using the time<br />
library of C++. The column #aff. tiles shows the number of tiles that need <strong>to</strong> be read<br />
for computing the given query. Column # preagg. tiles represents the number of preaggregates<br />
that can be used <strong>to</strong> compute the query. Column t pre shows the <strong>to</strong>tal CPU<br />
cost of computing the query considering pre-aggregated data. Column t ex shows the<br />
time taken <strong>to</strong> execute the query entirely from raw data. Column ratio shows that CPU<br />
time is always better when the computations consider pre-aggregated data.<br />
Table 4.3. Comparison of Query Evaluation Costs Using <strong>Pre</strong>-Aggregated Data and<br />
Original Data.<br />
Q id #aff. tiles #preagg. tiles t pre t ex ratio<br />
Q1 63 24 15.6 17.8 87%<br />
Q2 35 24 6.9 9.3 74%<br />
Q3 35 8 9.4 10 94%<br />
Q4 5 5 1.02 1.55 65%<br />
Q5 5 5 1.1 1.63 67%<br />
Q6 5 5 0.74 1.01 73%<br />
Q7 2 1 0.04 0.41 9%<br />
Q8 2 1 0.04 0.45 8%<br />
Q9 2 1 0.04 0.41 9%<br />
4.5 Summary<br />
In this chapter we presented a framework for computing aggregate queries in array<br />
databases using pre-aggregated data. We distinguished among different types of


