

Applying OLAP Pre-Aggregation Techniques to ... - Jacobs University
Applying OLAP Pre-Aggregation Techniques to ... - Jacobs University
Applying OLAP Pre-Aggregation Techniques to ... - Jacobs University

Create successful ePaper yourself
Turn your PDF publications into a flip-book with our unique Google optimized e-Paper software.
98 5. <strong>Pre</strong>-<strong>Aggregation</strong> Support Beyond Basic Aggregate Operations<br />
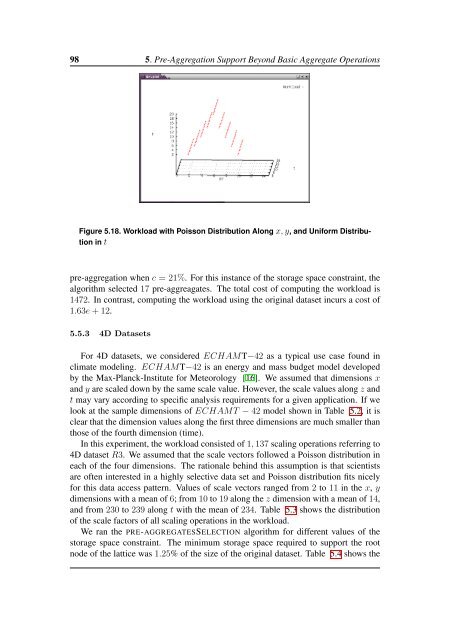
Figure 5.18. Workload with Poisson Distribution Along x, y, and Uniform Distribution<br />
in t<br />
pre-aggregation when c = 21%. For this instance of the s<strong>to</strong>rage space constraint, the<br />
algorithm selected 17 pre-aggreagates. The <strong>to</strong>tal cost of computing the workload is<br />
1472. In contrast, computing the workload using the original dataset incurs a cost of<br />
1.63e + 12.<br />
5.5.3 4D Datasets<br />
For 4D datasets, we considered ECHAMT−42 as a typical use case found in<br />
climate modeling. ECHAMT−42 is an energy and mass budget model developed<br />
by the Max-Planck-Institute for Meteorology [16]. We assumed that dimensions x<br />
and y are scaled down by the same scale value. However, the scale values along z and<br />
t may vary according <strong>to</strong> specific analysis requirements for a given application. If we<br />
look at the sample dimensions of ECHAMT − 42 model shown in Table 5.2, it is<br />
clear that the dimension values along the first three dimensions are much smaller than<br />
those of the fourth dimension (time).<br />
In this experiment, the workload consisted of 1, 137 scaling operations referring <strong>to</strong><br />
4D dataset R3. We assumed that the scale vec<strong>to</strong>rs followed a Poisson distribution in<br />
each of the four dimensions. The rationale behind this assumption is that scientists<br />
are often interested in a highly selective data set and Poisson distribution fits nicely<br />
for this data access pattern. Values of scale vec<strong>to</strong>rs ranged from 2 <strong>to</strong> 11 in the x, y<br />
dimensions with a mean of 6; from 10 <strong>to</strong> 19 along the z dimension with a mean of 14,<br />
and from 230 <strong>to</strong> 239 along t with the mean of 234. Table 5.3 shows the distribution<br />
of the scale fac<strong>to</strong>rs of all scaling operations in the workload.<br />
We ran the PRE-AGGREGATESSELECTION algorithm for different values of the<br />
s<strong>to</strong>rage space constraint. The minimum s<strong>to</strong>rage space required <strong>to</strong> support the root<br />
node of the lattice was 1.25% of the size of the original dataset. Table 5.4 shows the


