
You also want an ePaper? Increase the reach of your titles
YUMPU automatically turns print PDFs into web optimized ePapers that Google loves.
Displaying Descriptive Statistics<br />
Analyzing Data<br />
Session<br />
window<br />
output<br />
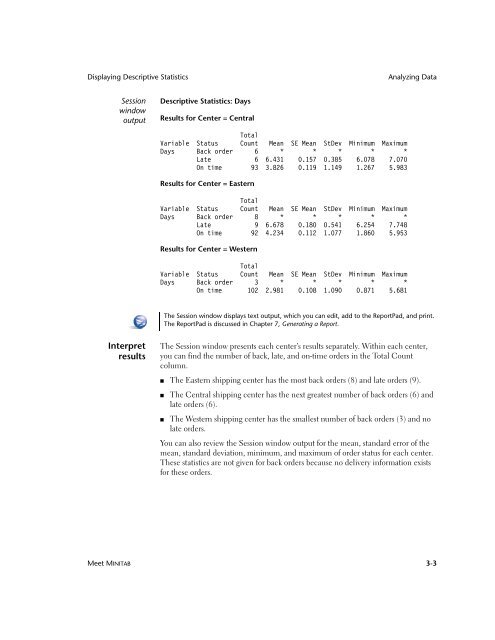
Descriptive Statistics: Days<br />
Results for Center = Central<br />
Total<br />
Variable Status Count Mean SE Mean StDev Minimum Maximum<br />
Days Back order 6 * * * * *<br />
Late 6 6.431 0.157 0.385 6.078 7.070<br />
On time 93 3.826 0.119 1.149 1.267 5.983<br />
Results for Center = Eastern<br />
Total<br />
Variable Status Count Mean SE Mean StDev Minimum Maximum<br />
Days Back order 8 * * * * *<br />
Late 9 6.678 0.180 0.541 6.254 7.748<br />
On time 92 4.234 0.112 1.077 1.860 5.953<br />
Results for Center = Western<br />
Total<br />
Variable Status Count Mean SE Mean StDev Minimum Maximum<br />
Days Back order 3 * * * * *<br />
On time 102 2.981 0.108 1.090 0.871 5.681<br />
The Session window displays text output, which you can edit, add to the ReportPad, and print.<br />
The ReportPad is discussed in Chapter 7, Generating a Report.<br />
Interpret<br />
results<br />
The Session window presents each center’s results separately. Within each center,<br />
you can find the number of back, late, and on-time orders in the Total Count<br />
column.<br />
■ The Eastern shipping center has the most back orders (8) and late orders (9).<br />
■<br />
The Central shipping center has the next greatest number of back orders (6) and<br />
late orders (6).<br />
■ The Western shipping center has the smallest number of back orders (3) and no<br />
late orders.<br />
You can also review the Session window output for the mean, standard error of the<br />
mean, standard deviation, minimum, and maximum of order status for each center.<br />
These statistics are not given for back orders because no delivery information exists<br />
for these orders.<br />
<strong>Meet</strong> MINITAB 3-3