Annual Report of the Department of Health 2010 - Unrwa
Annual Report of the Department of Health 2010 - Unrwa
Annual Report of the Department of Health 2010 - Unrwa

You also want an ePaper? Increase the reach of your titles
YUMPU automatically turns print PDFs into web optimized ePapers that Google loves.
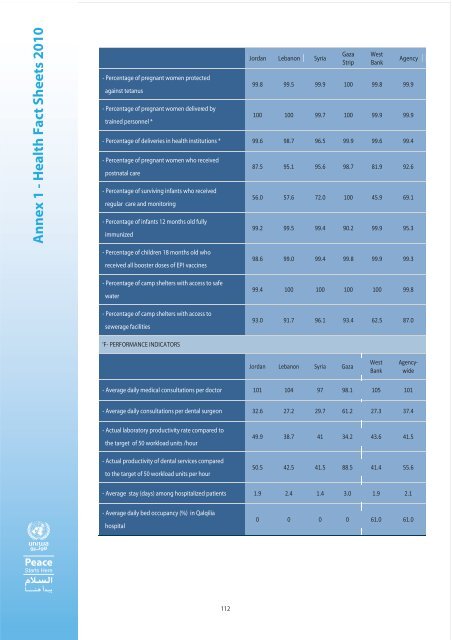
Annex 1 - <strong>Health</strong> Fact Sheets <strong>2010</strong><br />
- Percentage <strong>of</strong> pregnant women protected<br />
against tetanus<br />
- Percentage <strong>of</strong> pregnant women delivered by<br />
trained personnel *<br />
Jordan Lebanon Syria<br />
Gaza<br />
Strip<br />
West<br />
Bank<br />
Agency<br />
99.8 99.5 99.9 100 99.8 99.9<br />
100 100 99.7 100 99.9 99.9<br />
- Percentage <strong>of</strong> deliveries in health institutions * 99.6 98.7 96.5 99.9 99.6 99.4<br />
- Percentage <strong>of</strong> pregnant women who received<br />
postnatal care<br />
- Percentage <strong>of</strong> surviving infants who received<br />
regular care and monitoring<br />
- Percentage <strong>of</strong> infants 12 months old fully<br />
immunized<br />
87.5 95.1 95.6 98.7 81.9 92.6<br />
56.0 57.6 72.0 100 45.9 69.1<br />
99.2 99.5 99.4 90.2 99.9 95.3<br />
- Percentage <strong>of</strong> children 18 months old who<br />
received all booster doses <strong>of</strong> EPI vaccines<br />
- Percentage <strong>of</strong> camp shelters with access to safe<br />
water<br />
- Percentage <strong>of</strong> camp shelters with access to<br />
sewerage facilities<br />
98.6 99.0 99.4 99.8 99.9 99.3<br />
99.4 100 100 100 100 99.8<br />
93.0 91.7 96.1 93.4 62.5 87.0<br />
'F- PERFORMANCE INDICATORS<br />
Jordan Lebanon Syria Gaza<br />
West<br />
Bank<br />
Agencywide<br />
- Average daily medical consultations per doctor 101 104 97 98.1 105 101<br />
- Average daily consultations per dental surgeon 32.6 27.2 29.7 61.2 27.3 37.4<br />
- Actual laboratory productivity rate compared to<br />
<strong>the</strong> target <strong>of</strong> 50 workload units /hour<br />
- Actual productivity <strong>of</strong> dental services compared<br />
to <strong>the</strong> target <strong>of</strong> 50 workload units per hour<br />
49.9 38.7 41 34.2 43.6 41.5<br />
50.5 42.5 41.5 88.5 41.4 55.6<br />
- Average stay (days) among hospitalized patients 1.9 2.4 1.4 3.0 1.9 2.1<br />
- Average daily bed occupancy (%) in Qalqilia<br />
hospital<br />
0 0 0 0 61.0 61.0<br />
112