Annual Report of the Department of Health 2010 - Unrwa
Annual Report of the Department of Health 2010 - Unrwa
Annual Report of the Department of Health 2010 - Unrwa

You also want an ePaper? Increase the reach of your titles
YUMPU automatically turns print PDFs into web optimized ePapers that Google loves.
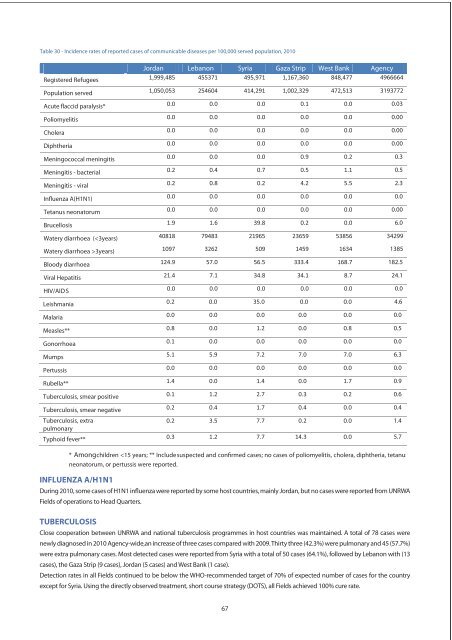
Table 30 - Incidence rates <strong>of</strong> reported cases <strong>of</strong> communicable diseases per 100,000 served population, <strong>2010</strong><br />
Jordan Lebanon Syria Gaza Strip West Bank Agency<br />
Registered Refugees 1,999,485 455371 495,971 1,167,360 848,477 4966664<br />
Population served 1,050,053 254604 414,291 1,002,329 472,513 3193772<br />
Acute flaccid paralysis* 0.0 0.0 0.0 0.1 0.0 0.03<br />
Poliomyelitis 0.0 0.0 0.0 0.0 0.0 0.00<br />
Cholera 0.0 0.0 0.0 0.0 0.0 0.00<br />
Diph<strong>the</strong>ria 0.0 0.0 0.0 0.0 0.0 0.00<br />
Meningococcal meningitis 0.0 0.0 0.0 0.9 0.2 0.3<br />
Meningitis - bacterial 0.2 0.4 0.7 0.5 1.1 0.5<br />
Meningitis - viral 0.2 0.8 0.2 4.2 5.5 2.3<br />
Influenza A(H1N1) 0.0 0.0 0.0 0.0 0.0 0.0<br />
Tetanus neonatorum 0.0 0.0 0.0 0.0 0.0 0.00<br />
Brucellosis 1.9 1.6 39.8 0.2 0.0 6.0<br />
Watery diarrhoea (3years) 1097 3262 509 1459 1634 1385<br />
Bloody diarrhoea 124.9 57.0 56.5 333.4 168.7 182.5<br />
Viral Hepatitis 21.4 7.1 34.8 34.1 8.7 24.1<br />
HIV/AID S 0.0 0.0 0.0 0.0 0.0 0.0<br />
Leishmania 0.2 0.0 35.0 0.0 0.0 4.6<br />
Malaria 0.0 0.0 0.0 0.0 0.0 0.0<br />
Measles** 0.8 0.0 1.2 0.0 0.8 0.5<br />
Gonorrhoea 0.1 0.0 0.0 0.0 0.0 0.0<br />
Mumps 5.1 5.9 7.2 7.0 7.0 6.3<br />
Pertussis 0.0 0.0 0.0 0.0 0.0 0.0<br />
Rubella** 1.4 0.0 1.4 0.0 1.7 0.9<br />
Tuberculosis, smear positive 0.1 1.2 2.7 0.3 0.2 0.6<br />
Tuberculosis, smear negative 0.2 0.4 1.7 0.4 0.0 0.4<br />
Tuberculosis, extra<br />
pulmonary<br />
INFLUENZA A/H1N1<br />
0.2 3.5 7.7 0.2 0.0 1.4<br />
Typhoid fever** 0.3 1.2 7.7 14.3 0.0 5.7<br />
* Among children