Annual Report of the Department of Health 2010 - Unrwa
Annual Report of the Department of Health 2010 - Unrwa
Annual Report of the Department of Health 2010 - Unrwa

You also want an ePaper? Increase the reach of your titles
YUMPU automatically turns print PDFs into web optimized ePapers that Google loves.
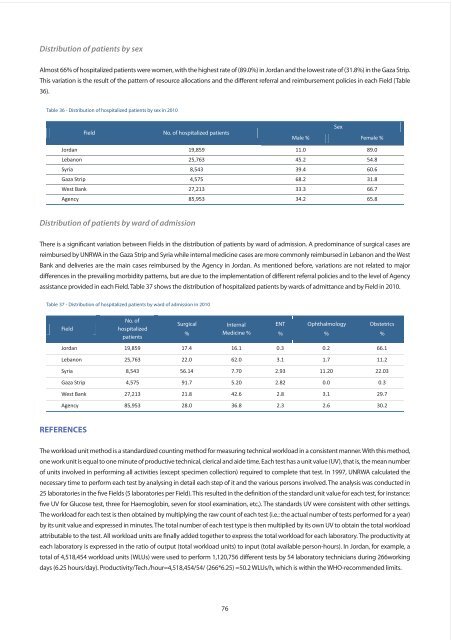
Distribution <strong>of</strong> patients by sex<br />
Almost 66% <strong>of</strong> hospitalized patients were women, with <strong>the</strong> highest rate <strong>of</strong> (89.0%) in Jordan and <strong>the</strong> lowest rate <strong>of</strong> (31.8%) in <strong>the</strong> Gaza Strip.<br />
This variation is <strong>the</strong> result <strong>of</strong> <strong>the</strong> pattern <strong>of</strong> resource allocations and <strong>the</strong> different referral and reimbursement policies in each Field (Table<br />
36).<br />
Table 36 - Distribution <strong>of</strong> hospitalized patients by sex in <strong>2010</strong><br />
Field<br />
No. <strong>of</strong> hospitalized patients<br />
Sex<br />
Male % Female %<br />
Jordan<br />
19,859<br />
11.0<br />
89.0<br />
Lebanon<br />
25,763<br />
45.2<br />
54.8<br />
Syria<br />
8,543<br />
39.4<br />
60.6<br />
Gaza Strip<br />
4,575<br />
68.2<br />
31.8<br />
West Bank<br />
27,213<br />
33.3<br />
66.7<br />
Agency<br />
85,953<br />
34.2<br />
65.8<br />
Distribution <strong>of</strong> patients by ward <strong>of</strong> admission<br />
There is a significant variation between Fields in <strong>the</strong> distribution <strong>of</strong> patients by ward <strong>of</strong> admission. A predominance <strong>of</strong> surgical cases are<br />
reimbursed by UNRWA in <strong>the</strong> Gaza Strip and Syria while internal medicine cases are more commonly reimbursed in Lebanon and <strong>the</strong> West<br />
Bank and deliveries are <strong>the</strong> main cases reimbursed by <strong>the</strong> Agency in Jordan. As mentioned before, variations are not related to major<br />
differences in <strong>the</strong> prevailing morbidity patterns, but are due to <strong>the</strong> implementation <strong>of</strong> different referral policies and to <strong>the</strong> level <strong>of</strong> Agency<br />
assistance provided in each Field. Table 37 shows <strong>the</strong> distribution <strong>of</strong> hospitalized patients by wards <strong>of</strong> admittance and by Field in <strong>2010</strong>.<br />
Table 37 - Distribution <strong>of</strong> hospitalized patients by ward <strong>of</strong> admission in <strong>2010</strong><br />
Field<br />
No. <strong>of</strong><br />
hospitalized<br />
patients<br />
Surgical<br />
%<br />
Internal<br />
Medicine %<br />
ENT<br />
%<br />
Ophthalmology<br />
%<br />
Obstetrics<br />
%<br />
Jordan 19,859 17.4 16.1 0.3 0.2 66.1<br />
Lebanon 25,763 22.0 62.0 3.1 1.7 11.2<br />
Syria 8,543 56.14 7.70 2.93 11.20 22.03<br />
Gaza Strip 4,575 91.7 5.20 2.82 0.0 0.3<br />
West Bank 27,213 21.8 42.6 2.8 3.1 29.7<br />
Agency 85,953 28.0 36.8 2.3 2.6 30.2<br />
REFERENCES<br />
The workload unit method is a standardized counting method for measuring technical workload in a consistent manner. With this method,<br />
one work unit is equal to one minute <strong>of</strong> productive technical, clerical and aide time. Each test has a unit value (UV), that is, <strong>the</strong> mean number<br />
<strong>of</strong> units involved in performing all activities (except specimen collection) required to complete that test. In 1997, UNRWA calculated <strong>the</strong><br />
necessary time to perform each test by analysing in detail each step <strong>of</strong> it and <strong>the</strong> various persons involved. The analysis was conducted in<br />
25 laboratories in <strong>the</strong> five Fields (5 laboratories per Field). This resulted in <strong>the</strong> definition <strong>of</strong> <strong>the</strong> standard unit value for each test, for instance:<br />
five UV for Glucose test, three for Haemoglobin, seven for stool examination, etc.). The standards UV were consistent with o<strong>the</strong>r settings.<br />
The workload for each test is <strong>the</strong>n obtained by multiplying <strong>the</strong> raw count <strong>of</strong> each test (i.e.: <strong>the</strong> actual number <strong>of</strong> tests performed for a year)<br />
by its unit value and expressed in minutes. The total number <strong>of</strong> each test type is <strong>the</strong>n multiplied by its own UV to obtain <strong>the</strong> total workload<br />
attributable to <strong>the</strong> test. All workload units are finally added toge<strong>the</strong>r to express <strong>the</strong> total workload for each laboratory. The productivity at<br />
each laboratory is expressed in <strong>the</strong> ratio <strong>of</strong> output (total workload units) to input (total available person-hours). In Jordan, for example, a<br />
total <strong>of</strong> 4,518,454 workload units (WLUs) were used to perform 1,120,756 different tests by 54 laboratory technicians during 266working<br />
days (6.25 hours/day). Productivity/Tech./hour=4,518,454/54/ (266*6.25) =50.2 WLUs/h, which is within <strong>the</strong> WHO-recommended limits.<br />
76