Annual Report of the Department of Health 2010 - Unrwa
Annual Report of the Department of Health 2010 - Unrwa
Annual Report of the Department of Health 2010 - Unrwa

Create successful ePaper yourself
Turn your PDF publications into a flip-book with our unique Google optimized e-Paper software.
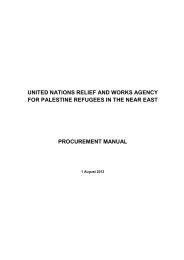
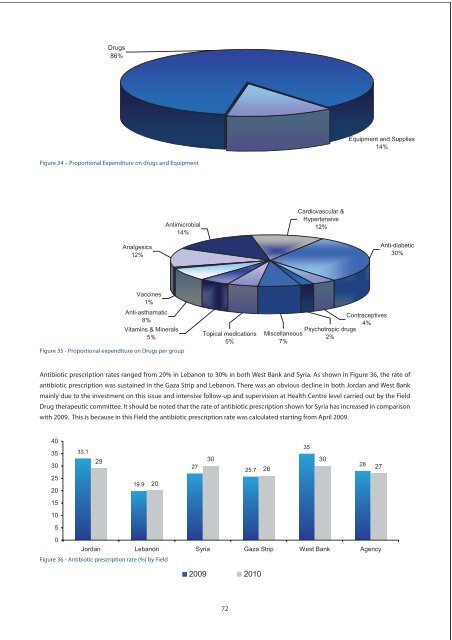
Drugs<br />
86%<br />
Equipment and Supplies<br />
14%<br />
Figure 34 – Proportional Expenditure on drugs and Equipment<br />
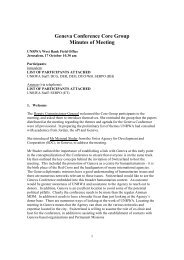
Antimicrobial<br />
14%<br />
Cardiovascular &<br />
Hypertensive<br />
12%<br />
Analgesics<br />
12%<br />
Anti-diabetic<br />
30%<br />
Vaccines<br />
1%<br />
Anti-asthamatic<br />
8%<br />
Vitamins & Minerals<br />
5%<br />
Figure 35 - Proportional expenditure on Drugs per group<br />
Topical medications<br />
5%<br />
Miscellaneous<br />
7%<br />
Psychotropic drugs<br />
2%<br />
Contraceptives<br />
4%<br />
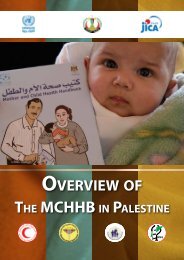
Antibiotic prescription rates ranged from 20% in Lebanon to 30% in both West Bank and Syria. As shown in Figure 36, <strong>the</strong> rate <strong>of</strong><br />
antibiotic prescription was sustained in <strong>the</strong> Gaza Strip and Lebanon. There was an obvious decline in both Jordan and West Bank<br />
mainly due to <strong>the</strong> investment on this issue and intensive follow-up and supervision at <strong>Health</strong> Centre level carried out by <strong>the</strong> Field<br />
Drug <strong>the</strong>rapeutic committee. It should be noted that <strong>the</strong> rate <strong>of</strong> antibiotic prescription shown for Syria has increased in comparison<br />
with 2009. This is because in this Field <strong>the</strong> antibiotic prescription rate was calculated starting from April 2009.<br />
40<br />
35<br />
35 33.1<br />
29<br />
30<br />
30<br />
30<br />
27<br />
28<br />
25.7 26<br />
27<br />
25<br />
19.9 20<br />
20<br />
15<br />
10<br />
5<br />
0<br />
Jordan Lebanon Syria Gaza Strip West Bank Agency<br />
Figure 36 - Antibiotic prescription rate (%) by Field<br />
2009 <strong>2010</strong><br />
72