Annual Report of the Department of Health 2010 - Unrwa
Annual Report of the Department of Health 2010 - Unrwa
Annual Report of the Department of Health 2010 - Unrwa

You also want an ePaper? Increase the reach of your titles
YUMPU automatically turns print PDFs into web optimized ePapers that Google loves.
Table 34 - In-patient care at <strong>the</strong> UNRWA hospital (Qalqilia, West Bank), in <strong>2010</strong><br />
Indicators<br />
Number <strong>of</strong> beds 63<br />
Patients admitted 6 133<br />
Bed days utilized 14 091<br />
Average daily bed occupancy 61.0 %<br />
Average stay in days 2.3<br />
7000<br />
6500<br />
6000<br />
5500<br />
5000<br />
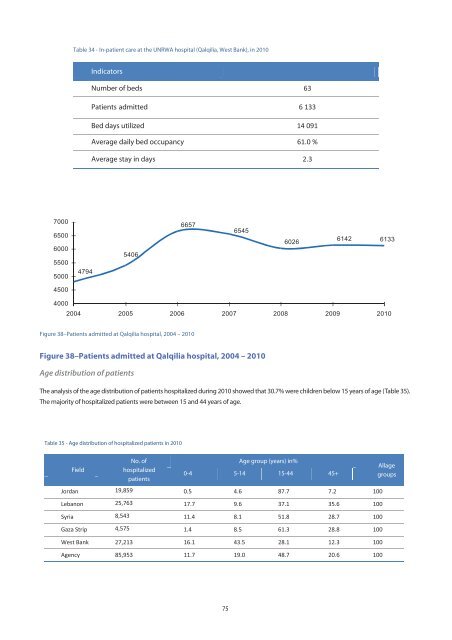
4794<br />
5406<br />
6657<br />
6545<br />
6026<br />
6142 6133<br />
4500<br />
4000<br />
2004 2005 2006 2007 2008 2009 <strong>2010</strong><br />
Figure 38–Patients admitted at Qalqilia hospital, 2004 – <strong>2010</strong><br />
Figure 38–Patients admitted at Qalqilia hospital, 2004 – <strong>2010</strong><br />
Age distribution <strong>of</strong> patients<br />
The analysis <strong>of</strong> <strong>the</strong> age distribution <strong>of</strong> patients hospitalized during <strong>2010</strong> showed that 30.7% were children below 15 years <strong>of</strong> age (Table 35).<br />
The majority <strong>of</strong> hospitalized patients were between 15 and 44 years <strong>of</strong> age.<br />
Table 35 - Age distribution <strong>of</strong> hospitalized patients in <strong>2010</strong><br />
Field<br />
No. <strong>of</strong><br />
hospitalized<br />
patients<br />
Age group (years) in%<br />
0-4 5-14 15-44 45+<br />
Allage<br />
groups<br />
Jordan 19,859 0.5 4.6 87.7 7.2 100<br />
Lebanon 25,763 17.7 9.6 37.1 35.6 100<br />
Syria 8,543 11.4 8.1 51.8 28.7 100<br />
Gaza Strip 4,575 1.4 8.5 61.3 28.8 100<br />
West Bank 27,213 16.1 43.5 28.1 12.3 100<br />
Agency 85,953 11.7 19.0 48.7 20.6 100<br />
75